
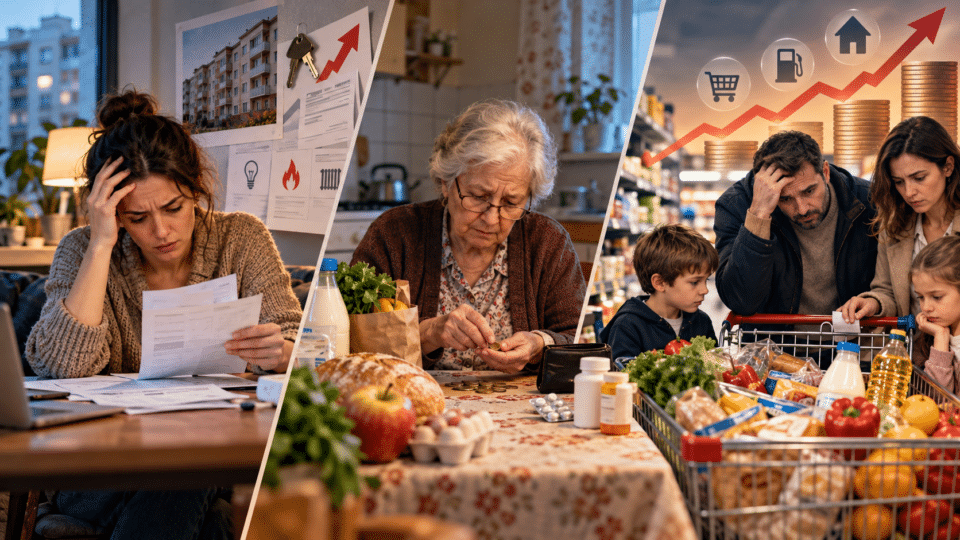
An annual inflation rate shows how the cost of a statistical basket has changed on average. It does not automatically show how much the budget has increased for a tenant renegotiating a lease, a pensioner with regular healthcare costs, or a family paying for food, transport and children’s services at the same time.
For more information on the cost of living, see Inflation fell to 6.2% in August, but services became more than 11% more expensive. Why lower inflation is not felt equally by everyone, which offers complementary details on the subject.
The available data for 2026 show precisely this gap between the average and household budgets. Eurostat reported annual harmonised inflation of 9.7% for Romania in May. For September, National Institute of Statistics (INS) data reported by AGERPRES put the annual consumer price index (CPI) rate at 6.61%: services were 11.12% more expensive than a year earlier, non-food goods 7.06% more expensive, and food 3% more expensive.
In brief: in September’s picture, services exerted more pressure than food. For a tenant, housing costs can become decisive when a lease is renewed or a move becomes necessary. For a pensioner, the actual share of food, utilities and healthcare in the budget matters most. For a family with children, the same average can mask greater exposure to transport, services and education-related spending. These are budget-risk profiles, not official inflation rates for each group.
Household inflation starts with choosing the right indicator
The first precaution concerns timing. The 9.7% HICP rate published by Eurostat refers to May 2026 and the European harmonised index. The 6.61% rate reported for September refers to the national CPI calculated by INS. Both are useful figures, but they do not cover the same month and should not be placed side by side as if they measured precisely the same basket.
The Harmonised Index of Consumer Prices (HICP) is designed for comparisons between EU countries. The CPI is the national indicator used to track consumer prices in Romania. Differences in coverage and weighting can matter, particularly when readers are trying to draw conclusions about a specific expense such as rent.
A second precaution concerns income. INS reported average total monthly household income of 9,399 lei in 2025 and average total expenditure of 8,037 lei, according to data provided to AGERPRES. These are national averages, not typical incomes for the three profiles discussed here. They nonetheless illustrate an important limit: when a large share of income is already committed to spending, a price increase concentrated in a fixed category can have a greater effect than the overall percentage suggests.
Tenant: housing costs can quickly outpace average inflation
Eurostat recorded an annual 41.2% rise in rents in Romania in its data for the second quarter of 2026. The indicator should be read cautiously: it does not prove that every rental contract became 41.2% more expensive. A lease already in force may have a fixed rent, with the effect appearing only at renewal, renegotiation or relocation. Individual circumstances also differ substantially between cities and market segments.
Even so, the series explains why a tenant may experience pressure far above the headline rate. Rent is generally a rigid monthly payment: it can be reduced only by changing home, sharing accommodation or moving to a cheaper area. Unlike a purchase that can be postponed, it does not disappear from the budget after a month.
For this profile, inflation cannot be assessed only through food prices. Tenants need to track rent, utilities, housing-related services and transport separately. For the wider context of housing costs, InfoBuz has already explained why the Eurostat percentage cannot be directly converted into an affordable rent for every salary.
Pensioner: frequency of spending matters as much as the pace of price rises
There is no single consumption pattern for pensioners. An owner-occupier with no mortgage or rent may have limited exposure to the housing market, but may devote a large part of their budget to food, energy, maintenance and healthcare. Another pensioner may pay rent or loan instalments, or provide financial support to family members.
The September data suggest that food recorded a lower annual rate of increase than services. That does not automatically mean food has become unimportant to pensioners. A category bought several times a week and accounting for a large share of the budget can explain more of the monthly pressure than a rapidly rising service used only rarely.
Healthcare spending must be treated separately. Without a comparable, up-to-date and sufficiently detailed series on medicines, out-of-pocket medical services and reimbursements, it is not possible to responsibly calculate an inflation rate for pensioners. Saying that “pensioners face the highest inflation” would go beyond the available evidence.
Families with children: several categories can rise at once
A family with children is not simply a household with a larger basket. It often makes more journeys, buys food more frequently and has service expenses that do not carry the same weight in a single person’s budget. In some months, concentrated costs may arise for education, clothing, activities or care.
It would not be accurate, however, to assume that all families with children face greater pressure than all other households. Income may be earned by one or two adults, the home may be owned or rented, and children’s ages radically change the pattern of spending. The relevant comparison is between each category’s share in a household’s own budget and the price change in that category.
For food, readers can add to the picture with InfoBuz’s analysis of the difference between farm, industrial and retail prices. It helps explain how prices are formed along the chain, but does not replace the calculation of a family budget.
A transparent method for a personalised basket
A useful calculation does not begin by assuming that every group has the same list of expenses. It starts with actual payments over recent months. The simplified formula is:
estimated basket rate = the sum of each category’s weight and its rate of price change.
If a category accounts for 20% of expenditure and its price rises by 10%, that category’s contribution to the change in the basket is 2 percentage points. The formula does not measure reductions in product quality, quantities a household gives up, or unexpected expenses. It measures only the effect of prices on a basket whose weights are stated.
| Editorial scenario | Categories to separate | What cannot be assumed automatically |
|---|---|---|
| Single tenant | Rent, utilities, services, transport, food | That the average rent indicator applies to their own lease |
| Pensioner | Food, utilities, healthcare, housing, transport | That all healthcare costs rise at the same rate |
| Family with children | Food, housing, transport, services, education and clothing | That total income shows the resources available per person |
Sensitivity analysis: assume, purely arithmetically, that 10% of a basket’s budget shifts from a category with an annual increase of 3% to one with an increase of 41.2%. The estimated basket rate rises by 3.82 percentage points: 0.10 × (41.2 − 3). The example does not claim that any tenant has exactly these weights, nor that every rent rose by 41.2%. It shows why the housing share must be stated before a result can be called meaningful.
What can be said now, and what would require more data
Based on the cited series, it can be said that the pace of price increases was not uniform across groups: in September, services rose faster than food, while Eurostat’s rent indicator points to particular pressure on the housing market. It can also be said that the same headline rate does not translate identically into different budgets.
It is not yet possible to publish a credible figure for “tenant inflation”, “pensioner inflation” or “family-with-children inflation” without official or explicitly stated weights for each scenario, and without sufficiently comparable series for all categories. Such a figure would need to be presented as an editorial simulation, showing the reference month, price sources, formula and limitations.
For a personal budget, the most prudent method is to add up spending over three to six months, group it into categories and compare it with the same period a year earlier. The difference between the totals paid shows a household’s concrete pressure; official indices can then help explain where part of it may come from. The two kinds of information complement one another, but are not interchangeable.
Frequently asked questions
Why can my inflation differ from the rate reported by INS?
INS calculates an average for a national statistical basket. If rent, energy, food or healthcare account for different shares of a household’s budget than they do in the statistical basket, the change in that household’s expenses may be lower or higher than the headline rate.
Can I use the 41.2% rise in rents to calculate my new rent?
Not automatically. Eurostat’s indicator is aggregated and does not replace an individual contract. A rent may remain fixed during the term of a lease, and changes vary by locality, area, type of home and the timing of renegotiation.
How do I calculate my own spending basket?
Divide spending from the past three to six months into categories, calculate each category’s share of the total, and compare the amounts paid with the same period in the previous year. Keep rent, utilities, food, transport, healthcare and recurring services separate.
Sources consulted
- Eurostat — Annual inflation up to 3.2% in the euro area, May 2026
- AGERPRES — Annual inflation rate rose to 6.61% in September
- Eurostat — House prices and rents continued to rise in Q2 2026
- AGERPRES — INS: Household income rose by an average of 13.6% in 2025
- Eurostat — Total household expenditure, corrected for inflation, and composition of EU household expenditure in 2024








Discuția cititorilor
Ai o opinie sau o întrebare despre acest articol? Spune-ne ce crezi.
Fii primul care deschide discuția.
Te rugăm să păstrezi un limbaj civilizat și să discuți la subiect. Comentariile spam sunt filtrate automat.