
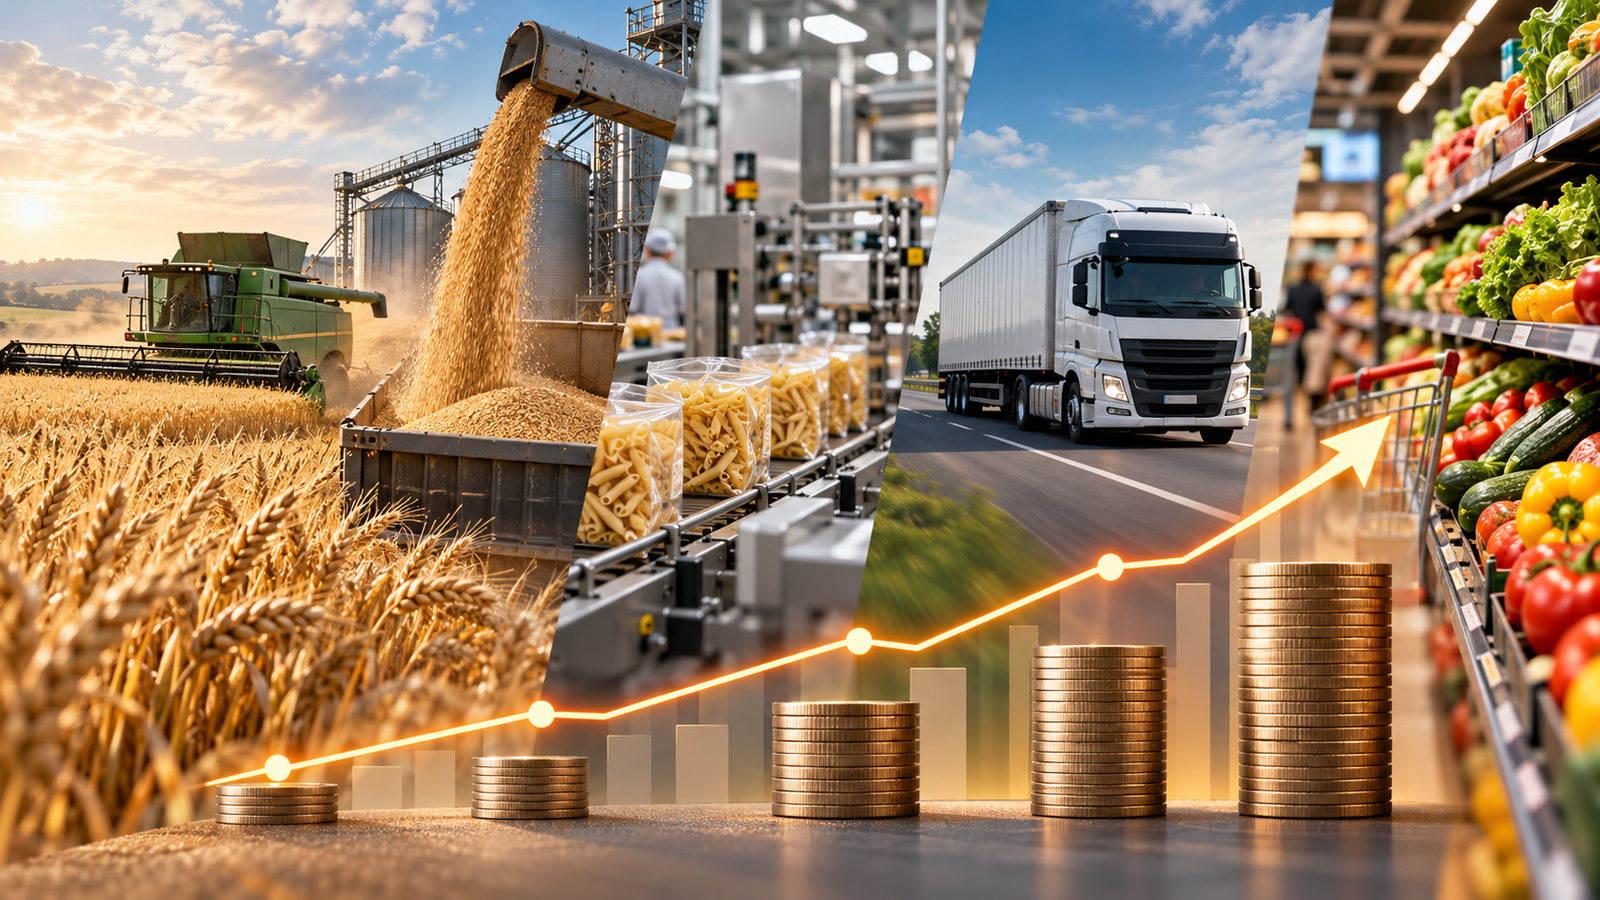
A farmer may receive a lower price for wheat while bread on the shelf does not become cheaper straight away. The question “why is food getting more expensive?” looks paradoxical only if the links between field and shopper are overlooked: storage, transport, processing, energy, packaging, labour, distribution and retail. Eurostat has a tool designed to track such differences — the Food Price Monitoring Tool — and it allows for better questions than “who raised the price?”
The issue is not that every link in the chain is unnecessary, or that every price increase proves an excessive margin. It is that the producer price, the price of an industrial product and the retail price are different indicators. They sometimes move at different speeds, and comparing them without a methodology leads to mistakes.
Why food prices rise: four stages and indicators
| Stage monitored | Eurostat indicator | What it measures |
|---|---|---|
| Agricultural raw materials | ACPI | Changes in agricultural product price indices |
| Imported products | IPI | Changes in the prices of goods bought from abroad |
| Food industry | PPI | Changes in producer prices in the food industry |
| Consumer | HICP | Changes in prices paid by households |
According to Eurostat documentation updated in July 2026, the tool covers 41 product chains and brings together these four indicators. The series uses a common reference base of 2025=100, but the indicators do not represent the same transaction. It is not possible to infer the margin of a particular supermarket by subtracting one index from another.
The case of bread: why wheat is not the whole price of a loaf
The price of bread includes the raw material, but also its conversion into flour, the bakery’s energy use, wages, packaging, production losses, logistics, distribution, premises rent, taxes and commercial margins. The precise proportions depend on the recipe, the facility, supplier contracts and the cost of each process. There is no universal formula under which a 10% fall in the price of wheat produces an identical fall in the price of bread.
Businesses also buy raw materials through contracts or from stocks. A change in this week’s quotation may feed through to costs with a delay, while cheaper inputs may be offset by higher wages or energy costs. This is an example of delayed and incomplete price pass-through, not automatic proof of abusive conduct.
From farm to shop: the path of a 10-leu price
The following example is a simulation intended as an explanation, not a statistical breakdown of a Romanian product. It takes an imaginary food item sold for 10 lei and divides the price between stages to show why the difference cannot all be described as profit.
| Component in the hypothetical example | Lei |
|---|---|
| Agricultural raw material | 2.10 |
| Processing, auxiliary ingredients and staff | 2.40 |
| Packaging and transport | 1.20 |
| Storage, premises and commercial operations | 1.60 |
| Taxes and other costs, including margins | 2.70 |
| Total shelf price | 10.00 |
The example is deliberately simplified: in reality, taxes can arise at several stages, some costs are shared across several products, and profit is only what remains after expenses. If one link owned the entire chain, the accounting would look different. This is precisely why such a division cannot serve as evidence against a company.
What recent data say about agriculture
Eurostat reported on 12 March 2026 that, in the fourth quarter of 2025, EU agricultural product prices at the farm gate fell by an average of 1.9% compared with the same quarter of 2024. Trends differed across product groups and countries. These figures show that European averages can conceal significant divergences; they do not automatically describe the rising price of every food item in Romania in October 2026.
For more information about Eurostat, see Rent in Romania beyond the Eurostat percentage: how much of your salary can you afford to spend on housing in 2026?, which offers complementary details on this subject.
In another analysis, Eurostat indicated that agriculture’s value added accounted for 2.5% of Romania’s GDP in 2024, above the EU average of 1.2%. This ratio is not an estimate of farmers’ profits; it expresses the sector’s contribution to the economy. Agriculture’s significant share does not guarantee strong bargaining power for every farmer.
Transport, energy and losses do not show on the label
Fresh food has different costs from products that are stable on the shelf. Fruit, milk and meat may require refrigeration, strict delivery times and the management of unsold goods. A transport disruption, a heatwave or higher energy costs can raise expenses without necessarily bringing the farmer a better price.
For imported goods, the exchange rate, international transport and the price paid to the foreign supplier can affect costs. For locally processed goods, electricity bills, fuel, labour availability and factory productivity can become decisive. The same product can have radically different cost structures in two regions.
What the gap between the farm-gate and shelf price does not prove
- On its own, it does not prove an agreement between retailers.
- It does not show the net profit of the producer, processor or retailer.
- It does not allow a kilogram of wheat to be compared with a kilogram of bread as though they were identical.
- It does not prove that a VAT reduction is passed on fully and immediately to the consumer.
- It does not explain why the same product costs differently in two shops without data on contracts and expenses.
A test any reader can do
Choose the same product, the same pack size and an observation period of four weeks. Record the price in two or three shops, any loyalty discounts, the unit price and changes in pack size. Compare the trend with the relevant official index. If you ask where the difference goes, look for company reporting and sector studies; do not turn a personal table into a national indicator.
A simple example shows why pack size matters: a 450g pack priced at 9 lei costs 20 lei/kg; a 400g pack at the same price costs 22.50 lei/kg. The front-of-pack price suggests stability, but the price per kilogram indicates an effective rise of 12.5%. This arithmetic can be checked without making any assumption about a retailer’s intentions.
Where public attention should be directed
Transparent monitoring of the supply chain helps identify variations and formulate the right questions. The European Commission and Eurostat do not publish this tool to declare one link in the chain guilty, but to compare price dynamics. Assessing a possible abuse requires a competition investigation, not simply a difference between two indices.
A high price is not always a high profit, and a low agricultural price does not guarantee cheap food. Understanding the mechanism begins with identifying every stage and refusing to confuse a change in an index with the exact allocation of a product’s takings.
Read also on InfoBuz
For a household-budget perspective: the gap between the average pension and the real cost of living.
Frequently asked questions
Why does bread not get cheaper when wheat does?
Wheat is only one of bread’s costs. Processing, energy, transport, wages, packaging and purchasing contracts affect the final price. A fall in the price of the raw material may reach shelves with a delay and may be offset by other costs.
Is the shelf price minus the farm price the retailer’s profit?
No. The difference covers several stages and operators, each with its own expenses. Even a comparison of Eurostat indices cannot calculate a company’s profit: this requires accounting data and a precise definition of what is being compared.
Why do two shops charge different prices for the same goods?
There may be differences in transport, contracts, purchase volumes, commercial strategy, losses and the cost of premises. A price difference alone does not prove illegal practices. Compare the same product, pack size, time and discount conditions before drawing conclusions.
How can I avoid being misled by smaller products at the same price?
Calculate the price per kilogram or litre and keep photographs of the pack size. If a package falls from 500g to 450g without a price change, the unit cost rises even though the amount shown at the checkout remains unchanged.


Discuția cititorilor
Ai o opinie sau o întrebare despre acest articol? Spune-ne ce crezi.
Fii primul care deschide discuția.
Te rugăm să păstrezi un limbaj civilizat și să discuți la subiect. Comentariile spam sunt filtrate automat.