
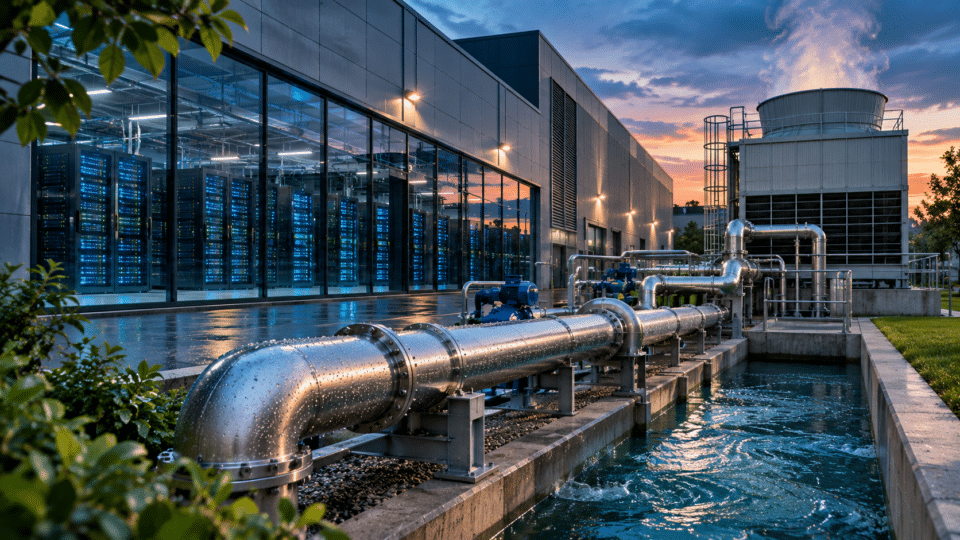
Artificial intelligence’s water consumption is not visible on screen when a user sends a question to a chatbot. Yet servers sit behind the response: they use electricity, generate heat and need cooling. Some data centres use water through evaporation; others use recirculating systems and dry cooling, while electricity generation can add an indirect impact. This raises the important question: how much water does AI actually consume, and who bears the pressure on local resources?
The answer cannot be reduced to the viral claim that “every question uses a bottle of water”. In 2025, Google estimated 0.26 millilitres of water for a median text prompt in Gemini Apps, using its own methodology. In its 2026 environmental report, the company said its data centres had consumed approximately 39.8 billion litres of water in 2025. The two figures are not contradictory: one is an estimate for a category of interactions, while the other is an aggregate operational total that also includes many other digital services. Google’s technical study; Google Environmental Report 2026.
To avoid confusion, this article distinguishes between water withdrawals, discharge, consumption, cooling water and water associated with electricity generation. It also separates figures published by operators, model estimates and our purely illustrative calculations.
AI water consumption: five different things
| Metric | What it measures | Why it matters |
|---|---|---|
| Withdrawal | Volume taken from a network, river, lake, well or another source | It can place demands on local infrastructure and resources |
| Discharge | Water returned after use, subject to applicable conditions | Not all withdrawn water is consumed permanently |
| Consumption | Water that does not return to the same source within a relevant period, including through evaporation | It indicates the quantitative pressure on the resource |
| Direct water | Water used at the data-centre site | It depends on cooling technology and climate |
| Indirect water | Water associated with electricity and other supply-chain processes | It cannot automatically be attributed in full to local consumption |
In operational reporting, consumption is often calculated as withdrawal minus discharge, using definitions and adjustments explained in the methodology. A facility may recirculate the same coolant volume many times; that does not mean it uses that same volume of fresh water every day. Conversely, a facility that evaporates water may require a continuous supply.
Why servers need cooling
Processors and graphics accelerators convert a substantial share of electrical energy into heat. If that heat is not removed, equipment reduces performance or may exceed its operating limits. Data centres use combinations of ventilation, heat exchangers, cooling liquids, evaporative towers and mechanical systems.
Evaporative cooling
In a cooling tower, the evaporation of part of the water helps remove heat. It can be energy-efficient under certain conditions, but requires make-up water and water-quality management. The volume circulating in a loop must be distinguished from the volume actually evaporated or discharged.
Air cooling and chillers
Dry cooling can reduce direct water consumption for cooling, but may require more electricity in some conditions. There is no universally optimal solution: climate, energy prices, water availability, permitted equipment temperatures and design all matter.
Direct-to-chip liquid cooling
Liquid circulates close to hot components in a closed loop. The fact that a facility uses water or liquid in pipes does not automatically mean it permanently evaporates that volume. Heat must still be transferred outside, and the overall impact depends on the final heat-rejection solution.
Microsoft has presented an AI data-centre design with zero water evaporated for cooling during operation, based on closed loops and direct-to-chip cooling. The company says water may still be used for other site activities. In 2026, it explained that its existing fleet uses several technologies, rather than this new design alone. Microsoft’s technical explanation; Microsoft’s June 2026 update.
How much water does a data centre consume? The WUE formula
An important metric is Water Usage Effectiveness (WUE), often expressed in litres per kilowatt-hour of IT energy. In an industry formulation, WUE compares annual water consumption associated with operation/cooling with the energy used by IT equipment over the same period. For comparisons, the exact definition in a report and the measured system boundary must be read carefully.
Hypothetical example: a data centre with an average IT load of 10 MW operates for 8,760 hours a year. Its IT energy use is 10,000 kW × 8,760 h = 87,600,000 kWh/year. At an assumed WUE of 0.20 L/kWh, calculated direct consumption would be 17.52 million litres/year. At 0.50 L/kWh, it would be 43.8 million litres/year. These are calculation scenarios, not measurements from any data centre in Romania.
| Hypothetical WUE | 10 MW IT / year | 20 MW IT / year | Interpretation |
|---|---|---|---|
| 0.00 L/kWh | 0 litres for the measured component | 0 litres | It does not automatically mean zero water across the entire energy chain |
| 0.10 L/kWh | 8.76 million litres | 17.52 million litres | Scenario with low direct intensity |
| 0.20 L/kWh | 17.52 million litres | 35.04 million litres | Intermediate illustrative scenario |
| 0.50 L/kWh | 43.80 million litres | 87.60 million litres | Illustrative scenario with higher intensity |
The table assumes the same average IT load throughout the year. A centre built for 20 MW but only partly used does not automatically consume as much as one operating continuously at 20 MW. Contracted capacity, installed capacity, actual IT load and the building’s total consumption should not be confused.
PUE and WUE: why electrical efficiency does not tell the whole story
Power Usage Effectiveness (PUE) compares a data centre’s total energy with the energy used by IT equipment. A PUE closer to 1 may indicate less energy used by auxiliary infrastructure. But a centre with a good PUE may use evaporative cooling and have a different WUE from one using dry cooling. Optimising one metric can involve trade-offs in another.
A sound assessment therefore requires, at a minimum, total energy, IT energy, WUE, water source, period and the local context of water stress. For the European framework on energy standards, see InfoBuz’s analysis of data-centre rules.
What Google reported in 2026: figures for 2025
Google’s 2026 report includes a useful breakdown for 2025, expressed in millions of US gallons. The conversion used below is 1 US gallon = 3.785411784 litres. These are company-reported figures, with limited assurance for certain indicators, rather than a census of all AI data centres worldwide.
| Google operations, 2025 | Millions of US gallons | Approx. billion litres |
|---|---|---|
| Total withdrawals | 14,689 | 55.60 |
| Total discharge | 3,820 | 14.46 |
| Total consumption | 10,869 | 41.14 |
| Data-centre consumption | 10,523 | 39.83 |
| Office and other-facility consumption | 346 | 1.31 |
Thus, approximately 39.8 billion litres represents the operational consumption of Google’s data centres in 2025, not “water consumed exclusively by Gemini”. Those facilities also support search, cloud computing, storage and numerous other services. The report separately presents withdrawals and discharge, as well as the site-by-site distribution. Google Environmental Report 2026, water tables, pages 96–97.
The report also says that, among freshwater withdrawals assessed under its risk framework, 13% came from sources classified as facing high depletion or scarcity risk, 15% from sources with medium risk, and 72% from low-risk sources. These percentages do not describe all water worldwide and do not mean that 13% of global water is at risk because of Google.
Does a Gemini prompt consume 0.26 mL? What that means precisely
In a 2025 technical paper, Google estimated that a median text prompt in Gemini Apps required approximately 0.24 Wh of energy and 0.26 mL of water, under its expanded methodology for calculating the impact of delivering a response. Google compares the water volume with roughly five drops. Google’s AI-impact methodology.
The figure is not a universal measurement for every question and cannot automatically be applied to ChatGPT, Claude, Grok or any other system. A long prompt, a multimodal response, a different model, a session using tools, or a data centre in a different region may have a different footprint. The study describes a median and a specific methodological boundary; it is not a complete lifecycle analysis of hardware and every electricity source.
Why “an AI question consumes a bottle of water” is an incomplete claim
Estimates in the literature can differ substantially depending on the model, hardware generation, cooling method, power grid and whether indirect water is included. A comparison between 0.26 mL and 500 mL does not automatically show that one researcher is wrong: the figures may measure different workloads, periods and system boundaries. What is misleading is turning a context-specific estimate into a rule for every prompt.
| Claim | What can responsibly be said |
|---|---|
| “Every AI question consumes 500 mL.” | There is no universal figure valid for every model and prompt. |
| “Gemini consumes 0.26 mL for every question.” | No. It is a median estimate from a defined methodology and period. |
| “A data centre with liquid cooling always consumes a lot of water.” | No. Liquid can circulate in a closed loop. |
| “If WUE is zero, the total water footprint is zero.” | No. Indirect consumption and other water uses may exist. |
| “All water withdrawn disappears.” | No. Some may be discharged, depending on the facility. |
Indirect water: power plants, chip factories and the supply chain
Data centres need electricity, and producing it can involve water. The water intensity of a kilowatt-hour varies considerably by energy technology, location, hydrological conditions and the definition used for withdrawal and consumption. Consequently, there is no single reliable global factor of litres of water per kWh that can be applied to every country without explanation.
A second layer is the manufacturing of chips and equipment, where ultrapure water may be used in industrial processes. That water is associated with the infrastructure’s lifecycle and should not be confused with cooling water consumed during a day of operation. Water used by suppliers also does not automatically appear in the operational balance of the company providing the AI application.
The International Energy Agency estimates that data centres globally consumed approximately 415 TWh of electricity in 2024, and that demand could reach around 945 TWh in 2030 in its base-case scenario. These figures concern all data centres, not AI alone, and are not expressed in litres of water. IEA — Energy and AI.
What happens when a data centre is built in a drought-hit area
The same water volume can have very different local consequences. In a region with abundant resources and appropriately sized infrastructure, the marginal impact may be manageable. In an area affected by drought, pressured aquifers and inadequate networks, the same withdrawal may compete with other uses. The source—drinking water, industrial water or reclaimed water—seasonality and any restrictions all matter.
A small annual balance does not guarantee an absence of pressure during the hottest weeks. With evaporative cooling, the hottest days may bring increased water demand. A credible project should therefore publish not only annual volume, but also its peak consumption, water source and local water-risk assessment. For broader context, InfoBuz has already examined water stress and competition for water.
Romania: what should be checked before approving an AI data centre
A project announced as an “AI factory”, “cloud region” or “data centre” does not by itself demonstrate that an operational centre already exists, that it has a given IT capacity, or that it withdraws a particular volume of water. In Romania, project documentation, relevant opinions and permits, the water-supply source, discharge conditions, impact studies and the responsible operator should all be reviewed.
- The estimated actual IT capacity and total electricity consumption, with expansion phases specified.
- The cooling type: evaporative, dry, hybrid or closed-loop liquid cooling.
- Estimated annual withdrawals, daily peak demand and actual consumption, rather than only recirculated flow.
- The water source: public network, industrial water, well, reclaimed water or another source.
- Discharge conditions and volumes, including any treatment.
- An assessment of water availability in dry periods and impacts on other users.
- PUE and WUE indicators, and the measurement methodology.
- Consumption-reduction measures and an independent monitoring system.
We do not give a water-consumption figure for a purported AI centre in Constanța or another locality without project documents and measurements. Instead, we propose a verification framework applicable to any announced investment. For an analysis of the energy infrastructure behind AI data centres, see InfoBuz’s article on the global race for energy.
European Union: why data centres must report water as well
The European energy-efficiency directive, Directive (EU) 2023/1791, and Delegated Regulation (EU) 2024/1364 created a framework for reporting performance indicators by data centres within their scope. Relevant information includes energy and water-use indicators, allowing better comparisons and assessments.
On 21 September 2026, the European Commission published an assessment report and proposed a common rating/labelling system for data centres. At the same time, it opened a consultation on possible minimum performance standards, with responses due by 14 December 2026 and legislative proposal expected in 2027. The proposal and consultation should not be presented as though all new minimum standards were already in force. European Commission — energy performance of data centres; September 2026 report.
What a responsible water policy means
| Measure | What it can improve | What must be checked |
|---|---|---|
| Dry or closed-loop cooling | Reduces water evaporated at the site | Possible additional energy consumption and indirect water |
| Reclaimed/non-potable water | Reduces reliance on drinking water | Availability, treatment and effects on other users |
| Separate metering of loops | Shows where water is lost | Calibrated meters, auditing and comparable data |
| Publishing seasonal consumption | Makes demand peaks visible | Not just the annual average |
| Siting adapted to local resources | May reduce pressure in sensitive areas | Hydrological studies and climate |
| Optimising IT workloads | Reduces heat generated per useful operation | Rebound effect from increased total volume |
Water reuse is not the same as automatically restoring resources. A “water replenishment” project may have benefits, but its location, timing, methodology and the relationship between volume saved or replenished and operations’ actual consumption must be examined. A global declaration is not sufficient if the problem occurs in a local river basin.
What might this mean at city scale? A hypothetical example
Assume a centre with an average IT load of 20 MW and a WUE of 0.30 L/kWh. Annual IT energy is 175.2 million kWh, and calculated direct consumption is 52.56 million litres per year, or 52,560 cubic metres. Divided by 365 days, this produces an average of about 144 cubic metres a day. This figure does not automatically include indirect water and does not describe daily peaks.
Comparisons with households would require a documented local figure for household consumption and the same definition of water. We do not convert the scenario into a “number of families left without water”, because such a calculation would wrongly suggest that the resource is transferred directly from households to servers.
Who can ask for transparency, and which information matters
Residents, journalists and public authorities can request public project data and environmental documents, within the limits of the applicable legal framework. Access to some commercial data held by a private operator may be limited, but permitting procedures and environmental assessments may contain relevant information. A responsible analysis separates measured data from estimates and identifies the source of every figure.
- How much water was actually withdrawn last year, and from which sources?
- How much water was discharged and how much was consumed?
- What volumes were used in the hottest month?
- What share came from reclaimed, non-potable or drinking water?
- What is the measured WUE, not merely the projected figure?
- What IT load and PUE correspond to the reporting period?
- What changes if computing capacity expands?
- Are there specific drought measures and withdrawal limits?
Frequently asked questions about AI water consumption
How many litres of water does a ChatGPT question consume?
There is no publicly verifiable universal figure for every ChatGPT question, regardless of model, length and infrastructure. Figures published for other systems, including Gemini, should not automatically be attributed to ChatGPT.
Google measured 0.26 mL per prompt. Does that apply to every AI system?
No. It is a median estimate for text prompts in Gemini Apps, according to the methodology and period reported by Google. Other systems may have different consumption levels.
Why do data centres use water if servers run on electricity?
The electricity used by servers turns into heat, and some technologies remove that heat by evaporating water. Other solutions can greatly reduce direct water consumption.
Can an AI centre operate without consuming water for cooling?
Yes. Designs using dry cooling and closed loops can avoid evaporating water for cooling during operation. That does not necessarily eliminate indirect consumption or other water uses.
Does a data centre always use drinking water?
No. The source may be drinking water, industrial water, reclaimed water or another authorised source. Proportions vary from site to site.
What does WUE mean?
It is an indicator of water-use intensity relative to IT energy, usually expressed in L/kWh. The measurement boundary and methodology should be checked for comparisons.
Is water used for cooling permanently lost?
Not all of it. Some may be recirculated or discharged. In evaporative cooling, a fraction is consumed through evaporation.
What figures do we have for Romania?
We do not present a verified national figure for water consumption exclusively attributable to AI in 2026. A serious estimate would require an inventory of facilities, reported consumption, cooling types and a separation of AI workloads from other digital services.
Conclusion: the right question is not only “how many drops per prompt?”
A single prompt may have a small footprint on a particular infrastructure, but billions of operations and the expansion of data centres can create substantial pressure on energy and water. Similarly, a large global total alone does not show where the greatest risks arise: a litre used in a drought-affected area can have a different significance from a litre used in a basin with abundant resources.
The relevant investigation in Romania should follow the location, water source, direct consumption, electricity demand, seasonal effects and operator transparency. In 2026, company-reported data and the European framework make these questions more concrete, but they still do not permit a universal number of litres “consumed by artificial intelligence”.
Official sources and research methodology
- Google Environmental Report 2026, tables for 2025: withdrawals, discharge, consumption, data centres and offices; conversion from US gallons to litres.
- Google — Measuring the Environmental Impact of Delivering AI at Google Scale: methodology and median estimate of 0.26 mL per Gemini prompt.
- Microsoft — Next-generation datacenters consume zero water for cooling: closed-loop cooling, limitations and energy trade-offs.
- Microsoft — June 2026 update on water intensity: cooling technologies in the existing fleet.
- IEA — Energy and AI: global electricity demand from data centres and scenarios to 2030.
- European Commission — Energy performance of data centres: database and water-consumption reporting.
- Delegated Regulation (EU) 2024/1364: indicators and reporting.
- European Commission — Report on the energy efficiency of data centres, 21 September 2026: assessment of reporting.
- Directive (EU) 2023/1791: European energy-efficiency framework.
Editorial note: researched on 17 November 2026. Google’s figures are company-reported data for 2025 and include non-AI services; the per-prompt figure concerns Gemini Apps, not all AI models. The 10 MW and 20 MW scenarios are illustrative only. This article does not attribute water consumption to projects in Romania without documentation, and does not confuse withdrawals with consumption. The image is an AI illustration, not a photograph of an identified data centre.



Discuția cititorilor
Ai o opinie sau o întrebare despre acest articol? Spune-ne ce crezi.
Fii primul care deschide discuția.
Te rugăm să păstrezi un limbaj civilizat și să discuți la subiect. Comentariile spam sunt filtrate automat.