
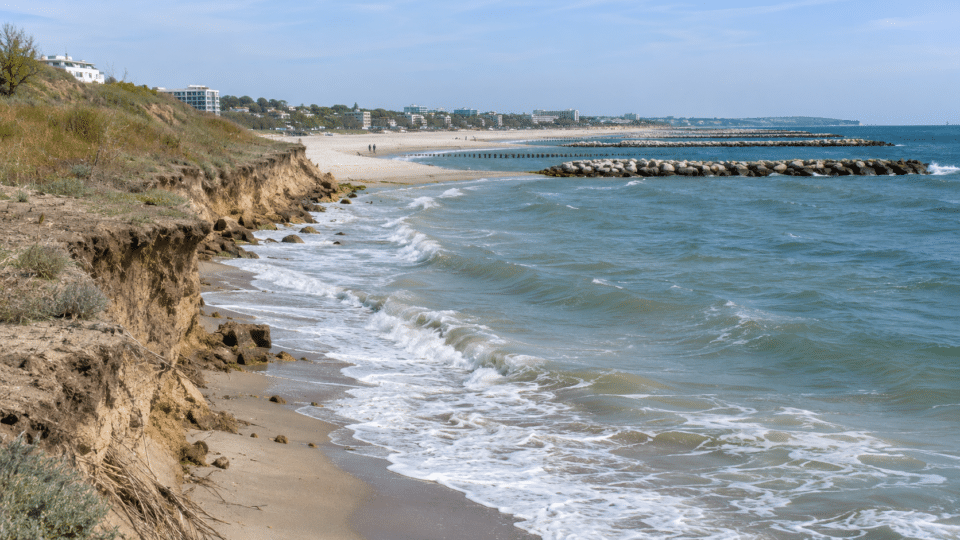
Erosion along Romania’s coast does not mean that the entire shoreline is losing sand at the same rate. Some sections are retreating, while others are accumulating sediment, and artificially widened beaches can look very different before and after a storm. Romania has built breakwaters and replenished beaches with sand on a large scale, but the central question remains: how can we verify that the protection works are effective, and how long can they last?
Documents from the National Administration “Romanian Waters” (ANAR) describe a coastline of roughly 244 km and a second phase of works covering 30.54 km of coastal protection and 226.16 hectares of new beach. These are not areas that can be declared fully completed and permanent without subsequent checks. The targets refer to the investment project; the physical outcome must be measured and monitored.
For more on the Black Sea, see Romania needs stronger rules for offshore extraction, which provides additional context on the subject.
We compared these targets with ANAR’s official documentation for Phase II, the national climate-change strategy approved in August 2025, and GeoEcoMar’s research on beach sediments. The result is a sector-by-sector analysis that explains the limits of the data—not a prediction that a particular beach will “disappear” in a fixed year.
Romanian coast erosion: what the official figures say—and what they do not say
| Indicator | Official figure | How it should be interpreted |
|---|---|---|
| Approximate length of the coastal zone | 244 km | An estimate from ANAR’s presentation, not a single length applicable to every measurement method |
| Phase I – protected coast | 7.3 km | Works completed during the earlier project, in sections of Constanța and Eforie Nord |
| Phase I – additional beach area | 60.66 ha | Reported outcome of the first project |
| Phase II – coast targeted for protection | 30.54 km | Cumulative target in the investment documentation |
| Phase II – new beach area | 226.16 ha | Project target, not a current verified inventory of beaches formally accepted on completion |
| Designed service life of the investments | 50 years | Design horizon for the protection systems, not a guarantee that sand will remain fixed in place |
The arithmetic conversion is useful: 226.16 hectares equals 2,261,600 m², or about 2.26 km². But that area cannot simply be divided by 30.54 km to calculate the “width of every beach”. The works are distributed across lots and include cliffs, groynes, breakwaters, sluice gates, and sections that did not receive the same amount of added sand.
Where the main risks are: the Danube Delta, Mamaia and southern cliff sections
The national strategy of August 2025 distinguishes between two coastal systems with different behaviour. In the north, associated with the Danube Delta, natural sections and vulnerable coastal barriers predominate. In the south, between Cape Midia and Vama Veche, ports, breakwaters and other developments exert a strong influence, while some cliffs may collapse if erosion affects their base. It would be inaccurate to treat the list of at-risk areas as a contemporary, same-date measurement of the rate of retreat for every kilometre.
| Coastal section | What the documents describe | What should be monitored |
|---|---|---|
| Canalul Sondei – Câșla Vădanei | Erosion risk in the northern Delta | Movement of the waterline and changes to coastal barriers |
| Sacalin Island, Zătoane – Perișor Nord | Erosion in sensitive natural areas | Sediments, habitats and the shape of the coastal barrier |
| Portița – Periboina | Pressure on the barrier between the sea and the Razim–Sinoie lagoon complex | Breaches or narrowing of the barrier, and lagoon salinity |
| Northern Mamaia and the Hotel Parc – Perla area | Sections with a history of erosion and protection interventions | The beach profile after replenishment, before and after storms |
| Belona – Petromar, Eforie | A section cited in strategic assessments | Beach stability, breakwaters and changes in sand |
| Costinești – 2 Mai – Vama Veche | Erosion risk and, locally, cliff instability | The base of the cliff, retreat of the edge and threats to infrastructure |
Why the shoreline changes: a question of the sand budget
A beach is a sediment store in almost continuous motion. Waves can move sand offshore or back towards land; currents transport it along the coast; and storms can substantially alter its profile over a short period. A visible retreat of the waterline does not always mean that all the sand has been permanently lost. Some may remain in a submerged bar and, under different conditions, may partly return to the beach.
The problem arises when, over the long term, less sediment enters a section than leaves it. Researchers call this difference the sediment budget. Romanian Waters explicitly explains that an imbalance between available sediment and the energy of waves or currents causes either erosion or accumulation.
- Natural sediment supply: the Danube and the coastal system carry mineral material, but works have altered volumes and routes.
- Port breakwaters and groynes: these may protect one section while altering sediment transport towards neighbouring sections.
- Storms: they can cause episodes of retreat that should not automatically be confused with a multi-year trend.
- Sea level: this affects the shoreline’s position and the vulnerability of low-lying areas, though the local effect depends on morphology and existing works.
- Human interventions: dredging, port development, shore protection and the artificialisation of the coast can alter the local balance.
Mamaia: why a restored beach should not be compared with a single past season
Mamaia is a classic example of the interaction between natural conditions and infrastructure. Official documents and specialist research refer to the historic effect of extending the Midia breakwater on sediment flows. Earlier studies recorded significant shoreline retreat, but those historical values cannot simply be projected onto the artificially widened beach after recent works.
When an urban-planning document, drawing on earlier analyses, refers to the possibility of a retreat of about 40 m over 20 years, it should be read as a historical projection dependent on assumptions, not as an actual measurement in 2026, nor as a forecast automatically valid after the beaches were reconfigured. The works change the very conditions on which earlier calculations were based.
For Mamaia, Phase II of the ANAR programme includes 6,950 linear metres of protection works and a target of 53 hectares of new beach. The fact that a beach appears wider in an image after an intervention does not, by itself, certify long-term effectiveness. Topographic profiles, widths, volumes and wave conditions must be compared at the same observation points.
What is being built and what is being delivered: Phase II investments
The national project includes works across 11 lots and different measures: artificial sand replenishment; extensions or removal of older structures; new breakwaters and groynes; artificial reefs; cliff stabilisation; and upgrades to sluice gates in the Edighiol–Periboina area. In ANAR communications, Phase II has an initial financing value of about 3.806 billion lei, under the contract of November 2018. This historical figure should not be presented as the total amount spent or as the final estimate updated in 2026.
| Section in the programme | Targeted protection length | Planned new beach |
|---|---|---|
| Mamaia | 6,950 m | 53 ha |
| Agigea | 1,200 m | 0.62 ha |
| Eforie | 5,750 m | 33 ha |
| Costinești | 2,550 m | 16 ha |
| Olimp | 3,500 m | 32 ha |
| Jupiter – Neptun | 2,550 m | 30 ha |
| Balta Mangalia – Venus – Aurora | 3,100 m | 37 ha |
| Mangalia – Saturn | 2,500 m | 20 ha |
| 2 Mai | 1,650 m | 4.5 ha |
| Tomis (Casino) | 790 m | Stabilisation/protection, with no listed target for new beach area |
ANAR still presents the project as a programme under implementation, and documents on the relevant websites have different update dates. We do not claim that every section has already been formally accepted on completion, or that all 226.16 hectares were usable on 14 November 2026. A picture of delivery would require completion-acceptance reports, payment statements, monitoring results and completion documents for each lot.
Why a 50-year service life does not mean sand will stay put
Official documentation uses a 50-year designed service life for the investments and describes designs for events with a given probability of occurrence. In coastal engineering, such wording concerns the performance of the protection system under its design assumptions, alongside monitoring and maintenance. It does not promise that every square metre of deposited sand will retain the same shape every summer.
A new beach can lose sand in a storm, recover some through natural processes, or require periodic replenishment. Its effectiveness must be assessed against the objective of the works: protecting infrastructure, reducing cliff vulnerability, maintaining a minimum width for safety, and preserving relevant habitats.
How to measure whether the works are effective: six indicators better than a drone photograph
- Shoreline position measured in the same reference system and in comparable seasons.
- Beach profile from the cliff or promenade to the submerged zone—not only the width of dry sand.
- Sediment volume gained or lost over the same section and period.
- Grain size and the compatibility of new sand with local wave and current dynamics.
- Condition of protective structures: breakwaters, groynes, reefs, slopes and stabilisation works after storms.
- Ecological indicators for marine habitats and conditions in protected areas.
Between 2019 and 2022, GeoEcoMar ran a research programme on sediment composition and dynamics specifically to underpin assessments of the works’ effectiveness. Its objectives included seasonal observations, bathymetric and grain-size measurements, hydrodynamic simulations, and analysis of “green” protection solutions. These methods show why a simple before-and-after comparison of tourist photographs is insufficient.
Three ways an image of a beach can mislead
1. Comparing a winter storm with a calm summer day
On a dynamic beach, powerful waves can move sand into the submerged zone. A photograph taken immediately after a storm may show a retreating shoreline, but it cannot on its own show how much sediment has been permanently lost from the system. Volume monitoring is needed, not only the visible position of the water.
2. Photographing beside a breakwater and generalising to the whole resort
A structure can encourage sand accumulation on one side and create a sediment-supply deficit on the other. Nearby photographs can therefore give opposing impressions. A judgement on an entire resort requires sector-level data and an understanding of longshore transport.
3. Using aerial images from different years without the same reference points
A satellite comparison must account for georeferencing, pixel resolution, the temporary sea level, wave form, season, the location of breakwaters and works completed between the images. A manually drawn outline over two photographs therefore cannot by itself be turned into “metres of erosion per year”.
New sand can affect nature if the sediment is unsuitable
Artificial sand replenishment should not be assessed only by the number of hectares. Grain size, the source of the material, temporary turbidity and effects on marine habitats can matter just as much. In certain protected areas, projects must be adapted to reduce pressure on ecosystems. ANAR refers to the integration of artificial reefs, while GeoEcoMar discusses vegetation-based and other “soft” solutions in sensitive sections of the Danube Delta.
It would be wrong to state that an artificial reef automatically benefits biodiversity, or that every sand intervention harms fauna. Results depend on location, design and post-construction measurements. A full investigation would require the environmental assessments and monitoring reports for each lot.
What is known about the future of the beaches—and what no single figure can predict
The 2025 national strategy notes persistent risks in the northern Delta and the southern cliff section. Sea-level rise may increase pressure on low-lying areas, and storms can abruptly alter the shape of beaches. But the cited documents do not provide a single official date on which a particular beach in Mamaia, Costinești or Vama Veche is expected to disappear.
Over the coming years, at least three local outcomes are possible: beaches that maintain good width through the works and maintenance; beaches that need further replenishment; and sections where risks remain significant despite interventions, especially at cliffs and in areas with a sediment deficit. These are scenario categories, not quantified forecasts for a particular resort.
What institutions should publish to assess the return on the investment
A multi-billion-leu project should be tracked through indicators, not inaugurations alone. For each lot, it would be useful to publish a standard record stating the completion-acceptance date, constructed length, initial sand area and volume, profiles measured after storms, any replenishment works, maintenance costs and ecological assessments.
An annual comparison of design targets with results actually measured, using the same methodology, would also be needed. Without that continuity, residents and local authorities cannot determine whether a wide beach seen in one year remains functional over time, or whether reducing a local risk has shifted pressure to another section.
The Danube connection: why sand is also a story about the river
The coastline is not separate from major river basins. The amount and type of sediment carried from the Danube, together with port breakwaters and coastal currents, affect the sediment balance in the Black Sea. River engineering works can reduce some of the material available downstream. But it would be inaccurate to attribute all erosion to a single cause: effects differ between the Danube Delta, Mamaia and cliff areas.
For context on the river’s role in Romania’s economy and environment, also see InfoBuz’s analysis of the effects of a low-flow year on the Danube. For an explanation of differences between types of sand, read why sand is a strategic resource. These articles provide context; they are not new measurements of coastal erosion.
Frequently asked questions about coastal erosion
Is erosion along Romania’s coast equally severe everywhere?
No. The risks and sediment dynamics differ between the northern Danube Delta, artificially protected beaches and southern cliffs. The list of vulnerable areas in the 2025 strategy is not a simultaneous measurement of every beach.
Have old beaches disappeared permanently after sand replenishment?
It is not possible to generalise. Works change beach configuration and sediment dynamics; at times, material is moved underwater or along the shore. Establishing a permanent loss requires analysis of the sediment budget over a longer period.
How much new beach did the state plan for Phase II?
The documentation gives a target area of 226.16 hectares of new beach, not a single sand volume expressed in cubic metres. Area cannot be converted into volume without average thickness, profile geometry and construction data.
Why are breakwaters and groynes built if they can alter currents?
They can reduce wave energy and stabilise certain sections. Their secondary effects must be assessed through modelling and monitoring, because structures can redistribute sediment transport.
Will new sand last 50 years?
The 50-year duration is the design life for the protection investments, subject to operating and maintenance assumptions. It is not a guarantee that every beach will retain the same width and sand volume without intervention.
How can I find out whether a beach is safe after a storm?
Follow official warnings and restrictions, rather than social-media images alone. Do not stand beneath cliff edges showing visible collapses, do not enter construction areas, and comply with signs concerning currents and swimming. The immediate danger is different from the multi-year rate of erosion.
How much had Romania actually spent by November 2026?
The cited public sources provide contracts and historical financing values, but they do not provide, in a single set verified for this analysis, the current cumulative value of payments and completion acceptances across all lots. We do not conflate the 2018 financing contract with the final cost of completed works.
Official sources and methodology
- National Administration “Romanian Waters” – “Coastal Zone Reduction and Rehabilitation”: Master Plan, Phases I and II, investments, targets and sections.
- Dobrogea–Litoral Basin Water Administration – “Coastal Erosion Reduction, Phase II” project: lots and types of works.
- National Climate Change Adaptation Strategy, published in August 2025: sections at risk of erosion and shoreline characteristics.
- National Plan for Implementation of the Strategy, 2025: risks, interventions and explanations of sediment dynamics.
- GeoEcoMar – 2019–2022 project on the composition and dynamics of beach sediments: monitoring methods and scientific assessment.
InfoBuz.ro editorial note, 14 November 2026: project figures are distinguished from completion-acceptance measurements and up-to-date monitoring; the scenarios describe possibilities, not predictions for a specific address or resort. The hectare–square metre–km² conversions are our own arithmetic calculations. This article did not carry out new bathymetric measurements, field observations or an independent estimate of the retreat rate for each section. The representative image is illustrative, not a documentary photograph of a verified location.






Discuția cititorilor
Ai o opinie sau o întrebare despre acest articol? Spune-ne ce crezi.
Fii primul care deschide discuția.
Te rugăm să păstrezi un limbaj civilizat și să discuți la subiect. Comentariile spam sunt filtrate automat.