
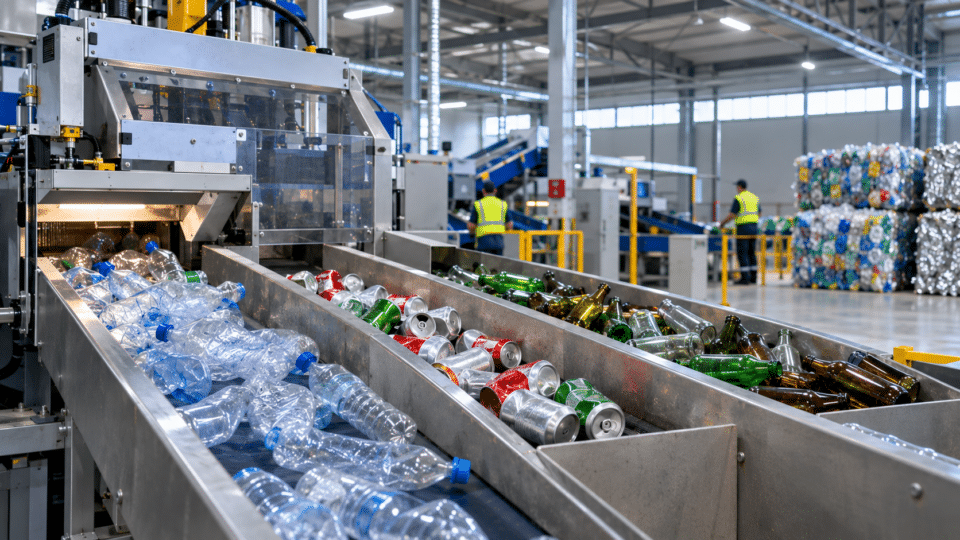
Constanța and Tulcea SGR: thousands of containers enter return machines every day at shops in cities, communes and resorts. But what do the official figures tell us about where they are returned and where they go? RetuRO data show that in April 2026 alone, 8,697,211 containers were reported in the municipality of Constanța, 2,078,660 in the municipality of Tulcea and 1,333,016 in Năvodari. These are returns recorded administratively in those localities—not the number of containers consumed by resident populations, nor the number physically recycled there.
This InfoBuz.ro investigation compares 11 localities in Dobruja and explains a container’s journey: from the person reclaiming the deposit, through the retailer and RetuRO centres, to the recycler. The period covered by the data must also be clearly defined. RetuRO’s official report for September 2026 is available in the archive, published on 25 October; however, this article uses April 2026 for its detailed table by locality because those figures could be verified directly. We do not extrapolate April figures to September or present them as the exact position in November.
Constanța and Tulcea SGR: What locality-level reporting shows in April 2026
RetuRO publishes separate data on returned plastic/PET, metal and glass containers for each territorial administrative unit in its reports. The table below adds together the three columns expressed as numbers of units—not weights in kilograms.
| Locality / territorial administrative unit | PET and plastic (units) | Metal (units) | Glass (units) | Calculated total (units) |
|---|---|---|---|---|
| Constanța | 4,564,008 | 2,275,037 | 1,858,166 | 8,697,211 |
| Tulcea | 1,050,924 | 656,964 | 370,772 | 2,078,660 |
| Năvodari | 628,194 | 405,301 | 299,521 | 1,333,016 |
| Mangalia | 583,706 | 366,380 | 275,255 | 1,225,341 |
| Medgidia | 487,556 | 319,079 | 225,616 | 1,032,251 |
| Eforie | 171,229 | 88,478 | 75,716 | 335,423 |
| Măcin | 144,079 | 83,148 | 62,053 | 289,280 |
| Jurilovca | 63,847 | 39,022 | 30,403 | 133,272 |
| Sulina | 26,062 | 23,930 | 9,175 | 59,167 |
| Murighiol | 17,499 | 9,982 | 10,060 | 37,541 |
| Costinești | 15,460 | 14,181 | 7,749 | 37,390 |
In the municipality of Constanța, the breakdown is about 52.5% plastic, 26.2% metal and 21.4% glass by number of containers. These percentages should not be confused with shares of the waste by weight: a glass bottle generally weighs considerably more than a can. Rankings by unit count and by kilograms may therefore look different.
Why Constanța cannot simply be compared with Sulina
Constanța has a different population, retail network and visitor flows from Sulina, Jurilovca or Murighiol. A container may also be bought in one locality, consumed in another and returned in a third. Seaside resorts have pronounced seasonality as well: the number of containers returned in a given month cannot automatically be equated with the environmental performance of residents.
A rigorous per-capita comparison would require a reference population for each territorial administrative unit, visitor consumption and returns, the number of return points, machine capacity, the periods during which they operated, and a series covering at least one year. Dividing a local total by the number of residents would yield only a crude indicator, heavily affected by tourists, commuters and nearby return points.
For example, Eforie and Costinești should not be described as recycling “leaders” or “laggards” on the basis of a single spring month. The population present in these areas changes during the summer season, and pressure on infrastructure may be entirely different. Testing the effect would require comparable reports for the same locality in April, July, August and September.
From return machine to recycler: the real route of an SGR container
RetuRO explains in its official materials that manually returned containers are transported to its regional centres, counted and sorted. Containers accepted through reverse-vending machines (RVMs), already identified and counted at the return point, are sent for sorting. The materials are then dispatched to recyclers, which turn them into secondary raw materials for new packaging or other products.
| Stage | What happens | Evidence that should be requested |
|---|---|---|
| 1. Purchase and deposit | When buying the product, an SGR deposit of 0.50 lei is paid for each eligible container. | Receipt and container carrying the SGR mark |
| 2. Return to the shop | The container is accepted manually or by machine, and the consumer receives the deposit back. | Record/voucher or refund procedure |
| 3. Collection and transport | Containers are collected through the logistics system managed by RetuRO. | Aggregate collection and traceability data |
| 4. Counting and sorting | Materials are counted/checked and grouped by material and characteristics. | Sorting reports and quantities handled |
| 5. Handover to recyclers | Plastic, metal and glass are transferred to recycling operators. | Handover documents, quantities and recipients |
| 6. Material recovery | The recycler processes the material for subsequent uses. | Recycling indicators and process losses |
A photograph of a full return machine proves, at most, that the installation accepted containers at a given time. It does not prove that every container has already been recycled. For the same reason, the statement “8 million containers were collected, therefore 8 million were recycled” is incorrect without data on later stages and on the methodology behind the recycling indicator.
Return, collection and recycling: three terms that should not be confused
At national level, RetuRO reports a return rate for January–September 2026 of 83% for plastic, 85% for metal and 89% for glass. The same dashboard separately displays recycling rates of 85% for plastic, 81% for metal and 84% for glass. These are indicators reported for the national system, not values observed in the two Dobruja counties.
| Material | National return rate, Jan.–Sep. 2026 | National recycling rate, Jan.–Sep. 2026 |
|---|---|---|
| Plastic | 83% | 85% |
| Metal | 85% | 81% |
| Glass | 89% | 84% |
The fact that a recycling percentage can be higher than the return percentage in the same presentation does not mean that “more containers were recycled than exist”. The indicators may use different calculation bases and points in the flow, for example from placement on the market to the processing of batches. Without the methodological sheet and stock series for each stage, we do not mechanically subtract one from the other to calculate “losses”.
What locality reports actually say about recycling in Dobruja
Local reporting is useful for showing where containers enter the system, by material and period. But it does not demonstrate that all containers in a territorial administrative unit are recycled at a plant in the same county. After collection, they may move through logistics centres and sorting facilities to specialised recyclers, depending on the network and contracts.
To answer precisely where a bottle from Tulcea ends up, batch-level traceability is needed: the collection point, sorting centre, accepted net weight, recycling operator, handover date and proof of processing. Local reports published as unit counts do not, on their own, provide the destination plant for every batch. We will not invent a Tulcea–Constanța route or name a particular recycler without documentation.
For more information about Constanța, see also Sheep and goat vaccination starts on 25 October: 1.1 million doses, two diseases and restrictions that remain in place, which provides complementary details on this subject.
Where vulnerabilities arise: communes, resorts and small retailers
A national system can have a good return rate while still being harder for some people to use. In practice, distance to a return point, opening hours, storage space, collection frequency, shop capacity and machine availability may all matter. Without on-site checks, we will not claim that a particular point in a commune is malfunctioning.
- Rural retail: the space available to accept and temporarily store containers may affect the consumer experience.
- Tourist localities: seasonal flows can create peaks in demand for returns, regardless of the number of residents.
- Access for people without a car: a return point at a considerable distance may discourage returns even if it appears on a map.
- Hospitality sector: containers collected by restaurants and accommodation businesses follow specific operational rules.
- Rejected containers: the issue may be related to eligibility, marking, the container’s shape or operation of the return point, and must be checked in context.
Who keeps the 50 bani, and what rights do consumers have?
Under SGR, a deposit of 0.50 lei per eligible container, separate from the product price, is paid at purchase. Plastic, glass and metal beverage containers between 0.1 and 3 litres inclusive are eligible if they meet the system’s requirements. Not all jars, milk containers or tins are covered by SGR. Being outside SGR does not mean that packaging is excluded from rules on separate collection or food safety. For context, see also InfoBuz’s analysis of new EU rules on food packaging and PFAS, a legal framework distinct from the deposit system for drinks.
According to RetuRO’s consumer questions and answers, a purchase receipt is not required and the product need not have been bought from the shop where it is returned. Automatic returns generally produce a voucher, usable in the shop or redeemable under the applicable rules; manual collection offers cash, voucher or bank-transfer options.
As an arithmetic illustration, 20 eligible containers × 0.50 lei = 10 lei recovered. This is repayment of an amount previously paid as a deposit, not a net gain of 10 lei or a state-funded “bonus”.
What should be published to properly assess each locality
For a more detailed picture, a local dataset should include the number of active points, machine availability, acceptance capacity, monthly volumes by material, collections carried out and any rejections. These are not all elements that must be published in the monthly locality report; they are indicators that a local investigation could request in order to measure real access.
Localities should be compared over a sufficiently long period, with seasonal populations estimated separately. A town with a heavily visited shopping centre may record returns originating in other localities. Without such adjustments, a “local return rate” calculated by dividing administratively recorded returns by residents’ assumed consumption would be misleading.
Five official questions that would turn reporting into a traceability investigation
- 1. How many SGR points were active in each territorial administrative unit in Constanța and Tulcea at the end of April and September 2026?
- 2. What quantities by material type were collected from each county, through which centres did they pass, and over what periods?
- 3. What net quantities from batches originating in Dobruja were handed over to recyclers, and where did recycling take place?
- 4. What proportion of material was rejected or lost during counting/sorting, and what methodology is used?
- 5. How are collection times and the operation of return points checked during the summer season and in low-population localities?
These questions do not claim that RetuRO or local authorities have refused to respond. They are proposed information requests for the next stage of documentation. Without responses and traceability documents, we do not assign a locality to a particular recycler or calculate a fictitious county recycling rate.
Frequently asked questions about SGR in Constanța and Tulcea
How many containers were returned in Constanța in April 2026?
For the municipality of Constanța, RetuRO’s report by territorial administrative unit shows 4,564,008 plastic containers, 2,275,037 metal containers and 1,858,166 glass containers: 8,697,211 in total. The figure does not cover every locality in Constanța County and is not an annual value.
Are RetuRO locality-level data available for September 2026?
Yes. The official archive lists locality-level reporting for September 2026, published on 25 October. This article does not assign local figures to September because the corresponding detailed table could not be directly verified in the present reporting.
Are containers returned in Tulcea recycled in Tulcea?
This cannot be inferred from the number of returned containers. Materials pass through logistics, counting/sorting and are dispatched to recyclers, which may be located in other counties. Batch destinations require additional documents.
Why can a resort have more returns than a commune with a similar population?
It may have different flows of tourists, commuters, shops and return points with different capacities. Returns are associated with the points where containers are handed in, not necessarily with the residence of the person who consumed them.
Do I need a receipt to reclaim the deposit?
No. RetuRO states that returning eligible SGR containers does not require the purchase receipt, nor must the return be made at the shop where the product was bought.
Can I return any jar or bottle?
No. The system has eligibility criteria for beverage packaging in the specified materials and volumes, carrying SGR identification. Ordinary jars, tins and many other types of packaging are not eligible.
Is the national return rate the same as the recycling rate in Constanța?
No. The publicly available national indicators apply to the entire system and use distinct methodological bases. They cannot automatically be converted into percentages for Constanța or Tulcea.
Official sources and calculation method
- RetuRO — locality-level reporting for April 2026 (published on 25 May 2026). The locality totals in this article are calculated by adding the three columns expressed in units.
- RetuRO — official archive of monthly reports, including documents for August and September 2026.
- RetuRO — national results dashboard for January–September 2026, with return and recycling rates by material.
- RetuRO — operational flow, from the return point to sorting and the recycler.
- RetuRO — consumer questions, including rules on deposits and returns.
- Government Decision No. 1074/2021, the SGR regulatory framework, as subsequently amended.
InfoBuz.ro methodology, 14 November 2026: the local reporting presented is for April 2026, while the national percentages cover January–September 2026; the periods are not mixed. Locality totals are calculated from unit counts, not kilograms. We did not physically track individual batches, conduct inspections at sorting centres or establish the destinations of recyclers by county. The article distinguishes what can be demonstrated from documents from questions for future research.








Discuția cititorilor
Ai o opinie sau o întrebare despre acest articol? Spune-ne ce crezi.
Fii primul care deschide discuția.
Te rugăm să păstrezi un limbaj civilizat și să discuți la subiect. Comentariile spam sunt filtrate automat.