
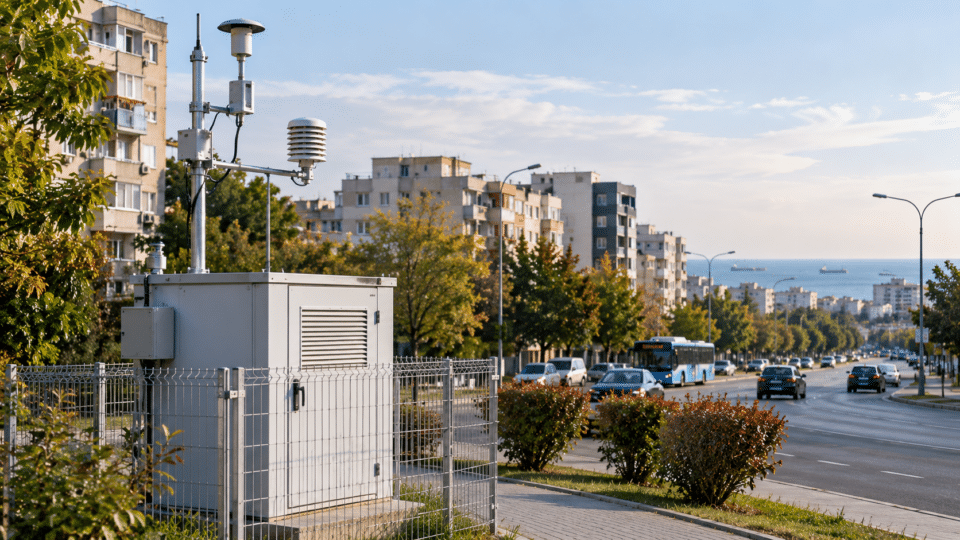
Constanța’s air quality cannot be properly assessed from a photograph of a clear sky or a single colour-coded indicator on a phone. Data in the proposed 2026–2030 Integrated Air Quality Plan show an important contrast: at the CT-1 traffic station, there were 56 days with PM10 above the daily threshold of 50 µg/m³ in 2023, but only 11 such days in 2024. At the same site, the annual PM10 average fell from 35.01 to 23.10 µg/m³. These are historical measurements from one station, not a verdict that the air in every neighbourhood has become safe.
A second signal appears in 2025: the municipal document gives the CT-2 urban-background station a PM10 average of 20.03 µg/m³, very close to the new annual limit of 20 µg/m³ set by EU legislation for 2030. The difference of 0.03 µg/m³ cannot be turned into a declaration of legal non-compliance today, especially without an analysis of uncertainty, validation and the rules applicable in the reference year.
At the same time, CT-2 is designated to monitor PM2.5, fine particles of major relevance to health, but the annual PM2.5-average series is not presented in the measurement chapter of the proposed municipal plan consulted for this article. The absence of a series from that document does not prove that PM2.5 was not measured. It does, however, show why readers cannot calculate a complete trend in fine-particle exposure from the plan alone.
For more on Constanța, see Hepatitis A outbreaks in Constanța and Romania: what the figures actually show, which provides complementary details on this subject.
Constanța air quality: three stations, three different kinds of information
Romania’s National Air Quality Monitoring Network (RNMCA) has three points in the Constanța urban agglomeration, as described in the municipal plan: CT-1, traffic; CT-2, urban background; and CT-5, industrial. Each was placed to provide a particular type of representativeness and has its own list of pollutants. A traffic station does not automatically describe a beach, and an industrial station should not be used as the average for the whole city.
| Station | Official type and location | Included in its monitoring list | Interpretive limitation |
|---|---|---|---|
| CT-1 | Urban traffic, 8 Bulevardul 1 Decembrie 1918 | PM10, NO2/NOx, SO2, CO, benzene and other compounds | Describes a traffic-influenced location, not every neighbourhood |
| CT-2 | Urban background, 2 Strada Mihai Viteazu | PM10, PM2.5, NO2/NOx, O3 and other pollutants | A measurement at the station does not mean the same concentration at every address |
| CT-5 | Urban industrial, 6 Strada Prelungirea Liliacului | PM10, NO2/NOx, O3 and other parameters | On its own, it does not identify the precise source of every pollution episode |
The plan says that data are transmitted online through the national calitateaer.ro platform, while final results undergo institutional validation. Values displayed in near real time may therefore differ from final statistics after checks of instruments, periods without data and certification procedures.
What the PM10 series shows: 56 exceedance days in 2023, 11 in 2024
The municipal document, published as a proposal in June 2026, includes annual PM10 averages measured by the gravimetric method and the number of days above 50 µg/m³. At CT-1, 2023 saw 56 days above the daily reference threshold, while the legal regime applicable that year allowed no more than 35 exceedances per year for this indicator. The plan’s authors link an important share of spring and summer episodes to roadworks.
| CT-1 indicator | 2023 | 2024 | What it means |
|---|---|---|---|
| Annual PM10 average | 35.01 µg/m³ | 23.10 µg/m³ | A reduction of about 34.0% at the same station |
| Days with PM10 above 50 µg/m³ | 56 | 11 | 45 fewer days, though the series are annual |
| Daily rule applicable at the time | Maximum 35 days above 50 µg/m³ | Maximum 35 days above 50 µg/m³ | A legal threshold, not a level below which health risk becomes zero |
The annual-average calculation is straightforward: (35.01 − 23.10) ÷ 35.01 × 100 ≈ 34.0%. For the number of exceedance days, the arithmetic decrease is about 80.4%. These percentages do not represent a fall in emissions from all sources or the exact reduction in an individual’s disease risk. They compare one station and two different indicators.
The plan explicitly mentions roadworks in explaining the 2023 peaks, but this is not equivalent to a verified quantitative allocation of every particle among traffic, construction sites, heating or natural dust. Such attribution would require further analysis of particle composition, weather conditions and sources, rather than an exceedance count alone.
What the 2025 table does not tell us: blank spaces are not air with zero concentration
There are years with missing values in the municipal PM10 series for 2020–2025. In 2025, CT-2 has an average of 20.03 µg/m³, while the table provides no annual average for CT-1 or CT-5 that year. CT-1 has figures for 2023 and 2024; CT-2 is missing some earlier periods. We cannot draw a continuous trend line for all stations as though missing values were ordinary measurements.
A dash in a report may mean there were not enough validated values for an annual average, that equipment did not produce the required series, or other technical circumstances that require clarification. It does not mean “PM10 = 0”, nor does it allow the conclusion that pollution disappeared from an area. A complete annual picture would require, for each pollutant and station, the data-capture percentage, the reasons for invalidation and periods without data.
At CT-2, the 2025 average of 20.03 µg/m³ is below the annual limit under the regime applicable in 2025–2026, which was 40 µg/m³ for PM10. Compared only for guidance with the annual limit set for 2030, 20 µg/m³, it is effectively at the new target level. A difference of 0.03 µg/m³ from a future threshold does not justify the alarmist claim that the city is “breaking the 2030 law” in 2026.
PM2.5 and PM10: why smaller particles should be tracked separately
PM10 refers to airborne particles with an aerodynamic diameter of up to about 10 micrometres, while PM2.5 is the finer fraction, up to about 2.5 micrometres. PM2.5 is included in PM10 mass; it is not a separate category that should be added to PM10. Size affects how particles penetrate the respiratory system and remain in the atmosphere; chemical composition and duration of exposure also matter.
PM10 can rise during episodes of resuspended dust, construction activity or regional transport of mineral particles. PM2.5 can include particles from combustion and aerosols formed secondarily from polluting gases. It is not accurate to say that PM10 means only construction dust, or that PM2.5 comes exclusively from traffic. Both fractions can have multiple sources and compositions.
According to the World Health Organization (WHO), exposure to particulate matter and other pollutants is associated with respiratory and cardiovascular risks. Children, older people and those with cardiovascular or respiratory diseases may be more vulnerable. A single air-quality index cannot, however, diagnose a disease or quantify one person’s risk.
Three different thresholds: the law applicable in 2026, the new 2030 directive and WHO guidance
Public debate often conflates three sets of values. Legal limits in 2026 are those applicable during that period under national law; the new EU directive establishes stricter standards to be attained by 1 January 2030; and WHO recommendations are health-based benchmarks, not automatic fines or legal limits.
| Pollutant and average | Legal limit relevant in 2026 | New EU limit from 2030 | 2021 WHO recommendation |
|---|---|---|---|
| PM10, annual average | 40 µg/m³ | 20 µg/m³ | 15 µg/m³ |
| PM2.5, annual average | 25 µg/m³ | 10 µg/m³ | 5 µg/m³ |
| PM10, daily average | 50 µg/m³, exceeded on no more than 35 days/year | 45 µg/m³, exceeded on no more than 18 days/year | 45 µg/m³, health recommendation with its own statistical rule |
| PM2.5, daily average | No equivalent general mandatory daily limit under the previous regime | 25 µg/m³, exceeded on no more than 18 days/year | 15 µg/m³, health recommendation with its own statistical rule |
Through Directive (EU) 2024/2881, the EU set more demanding protection rules for the years ahead. This does not mean that all 2030 values already apply retroactively to the 2025 average. At the same time, an annual average being legal in 2026 does not mean that exposure is free of health effects; WHO recommends lower levels.
What a traffic station shows — and what it does not
CT-1 is located at 8 Bulevardul 1 Decembrie 1918, an urban location strongly influenced by traffic. A local increase may be caused by vehicles, resuspended dust, works, changing weather or combinations of these factors. The station is valuable precisely because it observes a particular type of exposure, but it cannot be used as the average for all of the city’s beaches, parks and streets.
CT-2, an urban-background station, and CT-5, an urban-industrial station, have different areas of representativeness. If CT-1 is yellow on a map and CT-2 is green, this does not automatically certify that a child between the two stations is breathing exactly the air displayed by either one. Wind, street geometry, buildings and nearby sources can create variation on a much smaller scale.
Constanța has a port and a sea: pollution that may remain outside a simplified picture
The port, ships, heavy vehicles, rail logistics, construction sites, building heating and urban transport can contribute in different ways to emissions in a coastal city. But the mere proximity of a station to the port does not demonstrate how much PM2.5 or PM10 comes from ships. Credible attribution requires analysis of aerosol composition, wind direction, hourly patterns and emission inventories.
Marine aerosols and Saharan-dust intrusions are two examples of natural contributions that can affect some measurements. Official procedures have special rules for substantiating, and where the law permits, subtracting natural contributions from compliance assessments. An episode automatically labelled “Saharan dust” cannot clear all human-made sources without meteorological and technical evidence. For context on dust transport, see InfoBuz’s analysis of Saharan dust and PM10 interpretation.
The 2026–2030 municipal plan is a proposal: what that means for measures
Constanța City Hall’s official page lists a “Proposal – Integrated Air Quality Plan 2026–2030”, and the document consulted states that it is “in preparation”. It can be used as a source for the historical series cited here and for proposed directions, but it should not be presented as a final plan approved by local decision in 2026 without that decision.
The proposal focuses in particular on NO2/NOx and PM10, with measures such as modernising major roads and public transport. The estimated effects of 2030 modelling are scenarios, not measurements taken in 2030 or promises that pollution will fall by an exact number of micrograms. Annual monitoring should distinguish measures that have actually been delivered from those that remain only in documentation.
Separately, the Constanța County Council publishes an air-quality maintenance plan for the county for 2024–2028. It should not be confused with the plan for the municipality of Constanța, which has a different perimeter, different obligations and different relevant stations. A projected result for a station in the county is not automatically a measurement of concentration in the city centre.
Four information gaps that warrant further investigation
- 1. The complete PM2.5 series: publication of validated annual averages, data capture and any missing intervals for stations that monitor fine particles.
- 2. An explanation of missing values: for CT-1 and CT-5 in the 2025 PM10 table, institutions should state the reason and whether comparable alternative data exist.
- 3. Source attribution: traffic, construction dust, industrial sources, heating, the port and regional transport should be assessed through technical analysis, not assumptions.
- 4. Results of measures: every mobility or dust-reduction project should have before-and-after indicators, methods and comparable periods.
These are editorial questions, not claims that stations were deliberately switched off or that authorities concealed data. A complete factual answer requires access to certified series, validation notes and equipment-maintenance schedules.
How to check Constanța’s air quality without misreading an app
- Open the official calitateaer.ro platform and identify the station, hour and pollutant. Do not treat the index colour as an annual value.
- Compare the right pollutant: PM2.5, PM10, NO2 and ozone have different effects, sources and standards.
- Check the period: an hourly value, daily average and annual average are not interchangeable.
- Follow data quality: missing hours or days can affect the calculation of an annual indicator.
- Consult the EEA as well: the European viewer of recent data allows examination of recent measurements reported by countries.
- For recurring discomfort or symptoms, seek appropriate medical advice; an app cannot establish the cause of symptoms.
The European Environment Agency says its recent-data viewer can show hourly and daily information over the last 30 days for pollutants including PM10, PM2.5, NO2 and ozone, while annual statistics are found in other datasets. The distinction is essential: you cannot check compliance with an annual PM2.5 limit by looking only at today’s index.
What a family can do on days with pollution episodes
During periods of confirmed elevated concentrations, vulnerable people can discuss with a doctor whether to reduce strenuous outdoor activities, choose less traffic-heavy routes and manage exposure. At home, controlling smoke sources and ventilation matters; an air purifier with an appropriate filter can be useful in certain conditions, but it does not remove outdoor pollution sources and is not medical treatment.
For a realistic technical choice, see InfoBuz’s guide to HEPA filters, CADR and activated carbon. To distinguish outdoor air from indoor problems involving CO2, humidity and mould, also read the analysis of indoor air quality.
Seven questions for authorities that would make monitoring more transparent
- What percentages of valid data did CT-1, CT-2 and CT-5 have for PM10 and PM2.5 in each year from 2023 to 2026?
- Why are no PM10 averages shown for CT-1 and CT-5 in 2025 in the municipal-plan table, and what validated series exist separately?
- Where can the annual PM2.5 averages at CT-2 be consulted, including the number of observations and the method?
- Are there particle-composition and source-attribution analyses for the PM10 episodes of 2023?
- What measures against construction dust and traffic had actually been implemented by November 2026, and with what performance indicators?
- How are the 2026–2030 municipal plan and the 2024–2028 county plan coordinated across their respective perimeters and pollutants?
- When will the adopted version of the new municipal plan, if applicable, be published, along with annexes, public comments and annual monitoring?
The questions are proposals for transparency at a later stage of reporting. This article does not claim they have already been sent to institutions or that those institutions have refused to answer.
Frequently asked questions about air quality in Constanța
Did Constanța’s air become safe in 2024?
CT-1 data show a substantial decline in the PM10 average and in days above the daily threshold compared with 2023. That does not automatically prove that air is safe in every neighbourhood or for every pollutant, and it does not replace analysis of PM2.5, NO2 and long-term exposure.
What does PM2.5 mean compared with PM10?
PM2.5 denotes a finer fraction of airborne particles included in PM10. They are not two masses that should be added together, and size alone does not establish a particle’s toxicity.
Were the legal PM10 limits exceeded in 2023?
The proposed municipal plan reports 56 days above 50 µg/m³ at CT-1, compared with the maximum of 35 such exceedances allowed under the applicable daily regime. A final legal classification must take account of validated series and the rules on natural contributions, where applicable.
Why are there no annual PM2.5 averages in the main table analysed?
The proposed municipal document focuses on NO2/NOx and PM10, although CT-2 is listed as a station that monitors PM2.5. Without the separately validated dataset, annual PM2.5 values cannot be established from that chapter, and we do not claim that the instrument was switched off.
Is the EU PM10 threshold already 20 µg/m³ in November 2026?
No. Directive (EU) 2024/2881 sets an annual PM10 limit of 20 µg/m³ to be attained by 1 January 2030. The rules corresponding to 2025–2026 apply to the legal assessment of data from those years.
Why do WHO recommendations and EU limits differ?
WHO issues health recommendations based on the scientific literature, while EU limits are legal standards with deadlines, methods and enforcement obligations. A legal level does not automatically equate to zero health risk.
Can an inexpensive home sensor prove a breach of the law?
A consumer sensor can help observe local variation, but it does not automatically replace the reference equipment, calibration, official procedures and validation required for a legal assessment.
How can I find today’s readings from CT-2?
Consult the official calitateaer.ro platform and select the station, pollutant and hour. Check whether the information is near real-time or validated, and do not confuse a short interval with an annual average.
Official documents and methodology
- Constanța City Hall – Proposed Integrated Air Quality Plan 2026–2030, June 2026. CT-1/CT-2/CT-5 data, Tables 2-7, 3-4 and 3-5, and the document’s status.
- Constanța City Hall – official air-quality plans page, including earlier implementation reports and the “proposal” designation for 2026–2030.
- Constanța County Council – documents for the county’s 2024–2028 air-quality maintenance plan, distinguishing it from the municipal plan.
- Law No. 104/2011 on ambient air quality, the framework for values applicable during the historical period analysed.
- Directive (EU) 2024/2881, PM10 and PM2.5 limit values to be attained by 2030.
- WHO – pollutant types and PM10 and PM2.5 recommendations, for the 2021 health benchmarks.
- European Environment Agency – where to access recent and historical data.
InfoBuz editorial note — 14 November 2026: Local figures are reproduced from the official proposed municipal plan published in June 2026, with reference data for 2023–2025, not from measurements taken by the newsroom in November. The calculation of the 2023–2024 change at CT-1 is arithmetic; it does not constitute causal or epidemiological assessment. A missing value in the table is not replaced with zero, nor is it attributed to a faulty sensor without evidence. Modelling data and 2030 scenarios are not presented as observed measurements. The article image is illustrative and does not depict an identified real RNMCA station.




Discuția cititorilor
Ai o opinie sau o întrebare despre acest articol? Spune-ne ce crezi.
Fii primul care deschide discuția.
Te rugăm să păstrezi un limbaj civilizat și să discuți la subiect. Comentariile spam sunt filtrate automat.