
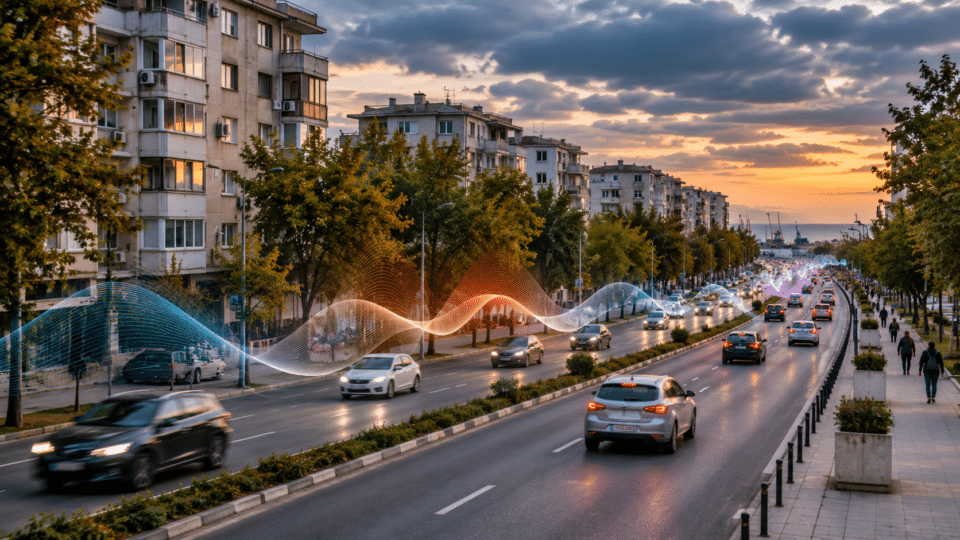
Constanța’s noise map is not simply a coloured diagram laid over the city. It is a technical document showing where traffic and other activities may affect sleep and quality of life, and what obligations the local administration has to reduce exposure. In the plan approved by Local Council Decision (HCL) No. 132/2026, the municipality estimates that 3,685 people are exposed to more than 70 dB(A) on the day-evening-night indicator (Lzsn) and 1,300 to more than 60 dB(A) on the night indicator (Lnoapte), based on road-noise modelling. These are estimates by exposure category, not real-time measurements or the number of people diagnosed with an illness. Source: Constanța Municipality Action Plan, section 6.1.
The document for 2024–2028 was approved in 2026, following an update of the strategic maps approved through HCL No. 83/2024. The reference date for the modelling is 31 December 2022. These dates matter: a figure published in a new document does not automatically represent the level measured in traffic in November 2026. Readers can check the data in the City Hall’s official library of maps and reports and in HCL 132/2026 and its plan annex.
What the official figures say: road traffic and residents’ exposure
| Indicator and category in the plan | Estimated population | How to interpret it |
|---|---|---|
| Lzsn, above 70 dB(A), road traffic | 3,685 people | Modelled annual exposure in the category above the stated threshold; not a permanent level at every address. |
| Lnoapte, above 60 dB(A), road traffic | 1,300 people | Modelled exposure for the night indicator; it is not equivalent to measuring a single noise event after 10pm. |
| Lzsn, above 56 dB(A), road traffic | 187,821 people | A different statistical threshold; it covers a much broader exposure category than the one above 70 dB(A). |
| Lnoapte, above 50 dB(A), road traffic | 127,200 people | A different indicator and threshold; it must not be added to the population exposed under Lzsn. |
The plan uses both 70/60 dB(A) threshold values and comparisons at 56/50 dB(A). Publishing only the largest figure, or adding all four figures together, would be misleading: the same person may appear in several classes, while the indicators describe different periods. These four figures do not represent four independent groups. For the figures, see section 6.1 of the original document.
Main roads are calculated separately
For the separate category of “main roads”, the plan reports 503 people above 70 dB(A) Lzsn and 71 people above 60 dB(A) Lnoapte. At the 56 and 50 dB(A) thresholds, the reported figures are 2,903 and 1,185 people respectively. This is a classification specific to the main roads included in the modelling, not a complete census of everyone living along major thoroughfares. The figures for main roads are not automatically added to the road-traffic total.
Lzsn and Lnoapte: two indicators answering different questions
Lzsn is the day-evening-night indicator, corresponding to the Lden metric used in European documents. It combines exposure levels for the three periods of the day into a long-term indicator, with additional weighting for the evening and night. Lnoapte, corresponding to Lnight, tracks the long-term average level for the night period. Neither is equivalent to the maximum value displayed for a few seconds by a phone at an intersection.
This is why a street can have an exposure colour on a strategic map even if a spot measurement taken during a visit is not identical. The models use data on traffic flows, sources, buildings and sound propagation; their accuracy depends on the quality of the input data. The national framework is set out in Law No. 121/2019 on the assessment and management of environmental noise.
Which parts of Constanța are exposed? The responsible answer is not an invented ranking
The public mapping distinguishes between road noise, industrial sources and other modelled categories, according to legal obligations and operators’ responsibilities. The document contains exposure tables for educational and healthcare buildings, as well as identified areas and projects. It is not possible to name a single “noisiest boulevard in Constanța” without comparing the same source, indicator, period and exposure class.
The plan explicitly mentions institutions on roads including I. C. Brătianu Boulevard, Alexandru Lăpușneanu Boulevard, 1 Mai Boulevard, Ferdinand Boulevard and Mangalia Road in building-exposure lists. The presence of an institution in a given map category should not automatically be turned into a claim that the entire road is uniformly exposed or that every apartment has the same noise level.
Schools and hospitals: why they are assessed separately
In section 6.1, the plan states that for road traffic and an Lzsn threshold above 70 dB(A), four schools and one hospital are identified; for Lnoapte above 60 dB(A), it identifies two schools and one hospital. These are classifications of buildings in the mapping study, not a diagnosis of the children or patients inside them. Sound insulation, room location and ventilation can alter indoor exposure.
The document lists, among others, Secondary School No. 8 and Secondary School No. 31 in exposure classes associated with I. C. Brătianu Boulevard. Hospitals also appear in examples of night-time classifications, including the Clinical Hospital for Infectious Diseases on Ferdinand Boulevard. This information should be read in the HCL tables and annexes, rather than taken out of context to stigmatise a medical facility or school.
Parks the plan seeks to retain as quiet areas
One of the more notable aspects of the documentation is that it does not only seek to reduce exposure where noise is already high, but also to protect less affected spaces. Section 5.4 provides for the preservation of quiet areas identified by the municipality:
| Space named in the plan | Area stated | What this means |
|---|---|---|
| City Hall Park | 4 ha + 0.5 ha (two identified areas) | A planning designation, not a guarantee of absolute quiet at every moment. |
| Poarta 6 Park | 1 ha | Protecting exposure must be considered alongside traffic and nearby activities. |
| Faleză Nord Park | 0.8 ha | A specifically defined area, not the entire seafront promenade. |
| Tăbăcăriei Park | 130 ha, including the lake | The broad area should be read within the plan’s boundaries, rather than automatically extended to every adjacent neighbourhood. |
The areas above are those recorded in section 5.4 of the plan. In practice, a “quiet area” is an urban-protection and planning concept, not a promise that traffic, construction work or activities will never be audible there. Law No. 121/2019 provides for the protection of quiet areas and their connection with urban planning.
Projects in the 2024–2028 plan — and what should not be announced too soon
The documentation includes projects to rehabilitate major roads, modernise public transport, expand green spaces and introduce traffic-management systems. These investments may influence noise, but a project’s inclusion in a table does not mean the work has been accepted on completion or that an effective reduction has already been measured.
| Measure / project in the plan | Details reported in the document | Editorial limitation |
|---|---|---|
| Traffic-management system, including video monitoring | Planned deadline: 30 December 2026; stated value: 100,000 lei, local budget | As of 17 November 2026, the deadline was still in the future; we do not state that the system was complete. |
| Construction of Madrid Boulevard, Tomis Plus area | 2,732-metre section; 43,760,042.48 lei; period given as 12 January 2026–12 February 2027; 0% in the document | The figure reflects the time when the document was prepared, not currently confirmed progress. |
| Procurement of low-emission buses | Several separate projects, with different deadlines and funding sources | We do not automatically attribute a quantified acoustic effect to the whole fleet. |
| Green-space and green-buffer projects | Works or procedures planned in the table | Noise reduction must be demonstrated through relevant modelling or measurement. |
For example, for the traffic-management measure, the plan gives 30 December 2026 as the completion date. Without later confirmation of acceptance on completion, the accurate wording is “scheduled to be completed”. Likewise, a deadline and percentage in a planning table do not replace an updated implementation report.
Why urban noise is a health issue, not merely a matter of comfort
Long-term exposure to transport noise is associated in public-health literature with sleep disturbance and a range of cardiovascular and wellbeing effects. But a noise map cannot say how many heart attacks or cases of insomnia were caused by a particular boulevard. Attributing risk requires consideration of the exposed population, epidemiology, vulnerability and other factors.
In its guidelines for the European Region, the World Health Organization recommends average exposure levels below 53 dB Lden for road traffic noise and below 45 dB Lnight at night. These health recommendations are not the same as every legally applicable limit in Romania, nor are they identical to the thresholds used in some tables in the local plan. Comparing them without explanation would mislead readers. Source: World Health Organization environmental noise compendium.
For an overview of who may be disproportionately affected, see InfoBuz’s analysis, Traffic noise affects the most vulnerable people most. For practical steps when choosing a home, see the bedroom-at-night traffic-noise test.
Strategic noise mapping versus a complaint about loud music, neighbours or a building site
A common mistake is to use a strategic map as instant proof that a neighbour, restaurant or construction site breached limits at a particular time. Such situations may fall under different rules: public-order legislation, permit conditions, health standards, or regulations governing construction sites and the environment. Strategic mapping is carried out at city scale using long-term exposure indicators.
For specific complaints, the relevant details are the location, source, hours, frequency, evidence lawfully held by the complainant and the competent authority. For urban-planning decisions, protection of quiet spaces or a noise-reduction plan, the starting point is the public strategic documentation.
How to check your own address: a six-step guide
- Open the City Hall page on the strategic-map update and identify the map type: road traffic, main roads or another source.
- Choose the appropriate indicator. Lzsn covers day, evening and night; Lnoapte is relevant to long-term night-time exposure.
- Read the legend: decibel classes cover ranges, and some categories refer to outdoor exposure at building façades rather than levels inside a room.
- Check the reference year and preparation date; Constanța’s plan uses 2022 reference data even though it was adopted in 2026.
- Compare the map with the home’s actual conditions: window orientation, floor level, bedroom location and traffic during the periods that matter to you.
- If circumstances have changed or the data are unclear, ask the institution for the dataset, an update or a methodological explanation, subject to the applicable legislation.
How much can a good window matter?
It can matter for indoor exposure, but without an assessment of the entire system, no fixed reduction in decibels can be promised. The window, ventilation, seals, room orientation and low-frequency sources interact. If the only ventilation option is opening a window towards a busy road, this also creates a practical ventilation problem. Read InfoBuz’s analysis of classroom ventilation, CO₂ and noise.
Five public questions Constanța should answer regularly
- Which measures undertaken under HCL 132/2026 have a contract, funding and an acceptance-on-completion record, rather than merely an entry in the plan?
- Where are comparisons published between the modelled 2022 situation and recent data, using the same indicators and methodology?
- Which interventions are being prioritised for educational and healthcare institutions in high-exposure classes?
- How are the boundaries of parks designated as quiet areas actually protected, including against new traffic?
- Which public indicators will show by 2028 whether residents have lower exposure, rather than simply whether the municipality has spent its budget?
These questions do not assert that City Hall has failed to carry out the work. They identify the documents needed to assess results and to distinguish promised investments from measured benefits.
Frequently asked questions about Constanța’s noise map
Is there an official noise map for Constanța?
Yes. City Hall publishes mapping documents, reports and the 2024–2028 noise-reduction plan, approved through HCL 132/2026. View the original documents.
Are the 3,685 people affected by 70 dB every evening?
The document does not support that conclusion. The number is an estimate of people exposed above a value class for Lzsn, an annual weighted indicator, rather than an instantaneous level recorded every evening.
Can I add 3,685 and 1,300 to find the total number of people affected?
No. The indicators can overlap at the level of exposed people and cover different periods. Adding them would double-count people and create an invalid statistic.
Is the map updated in real time?
No. Strategic maps are periodic exposure models, not live sound-level monitoring platforms. The document examined has a reference date of 31 December 2022.
Is Tăbăcăriei Park completely free of noise?
That is not what the plan says. It provides for the retention of a 130-hectare area, including the lake, as a quiet area in the sense used by the documentation. Spot noise levels may vary by location and time.
Can residents ask City Hall to update the data?
Yes. Residents can request available public information and clarification on administrative documentation, under the applicable rules. Such a request does not guarantee that a new measurement campaign will be conducted immediately.
A quieter city is measured in lower exposure, not in the number of announced projects
Constanța has an official basis for a verifiable discussion about noise: strategic maps, exposure classes, sensitive institutions and an action plan. The figures matter, but only if the thresholds, indicators and reference date are read correctly. The next stage of public scrutiny is to compare approved measures with completed investments and any quantified reductions in exposure. That is the difference between an administrative report and an evaluated public policy.
Official sources, methodology and limitations
- Constanța City Hall — strategic noise-map update: published maps and reports, HCL 83/2024 and HCL 132/2026.
- Constanța noise-reduction action plan, 2024–2028: exposure values, quiet areas, list of measures and project timetable.
- Local Council Decision No. 132/2026 and annex: text of the approved documentation.
- Law No. 121/2019: obligations on strategic mapping, access to information, action plans and quiet areas.
- WHO — environmental noise exposure: health-recommendation thresholds, distinct from national legal limits.
- Ministry of Transport and Infrastructure Order 3950/2024: the separate plan for the Constanța Port area.
Editorial note: This article was researched on 17 November 2026. The plan’s data are estimates obtained through mapping and refer to the baseline year stated in the document. They are not real-time measurements and do not demonstrate the actual status of each project on the publication date. The featured image is an AI-generated editorial illustration, not a verification photograph of a specific road in Constanța and not the official map.







Discuția cititorilor
Ai o opinie sau o întrebare despre acest articol? Spune-ne ce crezi.
Fii primul care deschide discuția.
Te rugăm să păstrezi un limbaj civilizat și să discuți la subiect. Comentariile spam sunt filtrate automat.