
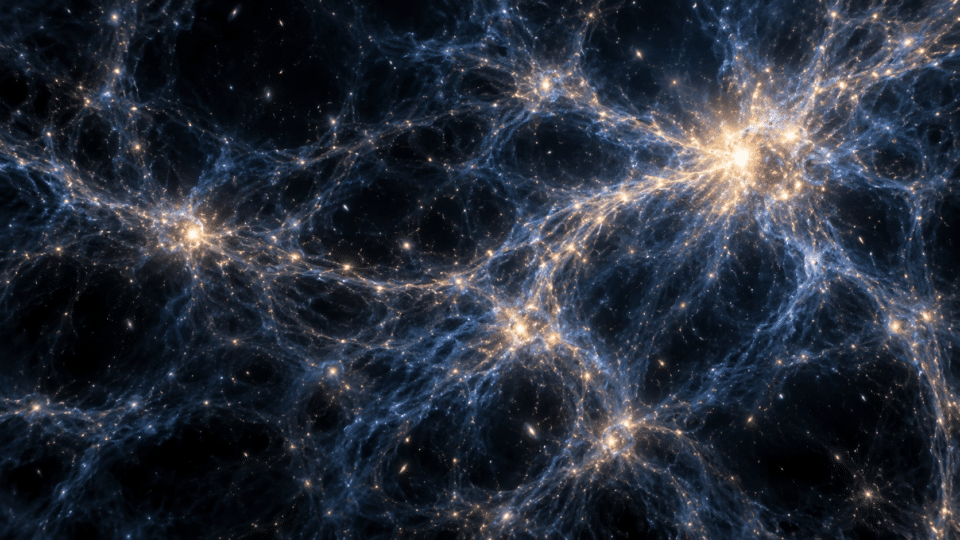
The Lumina simulation addresses a question no telescope can follow as a continuous film: how did the first galaxies change their surroundings? The research, presented on 26 October 2026, tracks dark matter, gas and radiation together across a vast region of the early Universe. The result is a computational reconstruction that can be used to compare theories with observations. The MIT announcement and the paper published in Monthly Notices of the Royal Astronomical Society describe the same research.
The stakes are clearest in an apparently simple image: bright patches grow around galaxies, expand and eventually meet. Behind them lies a transformation in the gas between galaxies. To understand what these animations show, it is necessary to follow both the light produced by stars and its effect on the matter it passes through.
For more on cosmology, see also James Webb captured the light from a possible supernova 12.5 billion years ago: what astronomers discovered, which offers complementary details on this subject.
What the Lumina simulation adds
- A large volume with galaxy-scale detail: the project computes a cosmological box measuring 500 comoving megaparsecs on each side.
- Processes computed together: the evolution of galaxies is linked to radiation transport and the state of intergalactic gas.
- Two important stages: the model follows hydrogen reionization and the later ionization of helium to its electron-free state.
- Testable predictions: the distribution of gas and the properties of galaxies can be compared with astronomical measurements.
These features are set out in the project’s technical description. Its useful innovation is the ability to link phenomena which, considered separately, leave open questions. A galaxy illuminates nearby gas; the heated gas changes its behaviour; the formation of further stars may in turn be affected.
What the Universe’s “dark ages” means
After the Universe’s hot beginning, expansion allowed matter to cool. Around 380,000 years after the Big Bang, electrons were able to bind to nuclei, forming neutral atoms. This stage is called recombination. Stars and galaxies did not yet fill the sky as we know it. NASA’s explanation of the first stars places their emergence between recombination and the formation of the earliest galaxies.
The expression “dark ages” can be misleading. It primarily describes the period before the first stellar sources of light. The Universe already contained radiation, and neutral hydrogen did not make it opaque in the same way at every wavelength. What matters here is the interaction between gas and radiation energetic enough to ionize it.
When such radiation strips an electron from a hydrogen atom, the atom becomes ionized. The first stars supplied ultraviolet radiation capable of causing this change. The process unfolded across space and time: sources did not switch on everywhere at once, and gas density was not the same everywhere. This sequence is explained in NASA’s material on the beginnings of starlight.
Imagine a night map on which cities gradually light up, followed by the connections between them. The analogy helps explain the uneven distribution, with one limitation: in the cosmos, light actually changes the physical state of its environment, while matter itself moves. The map must be recalculated continuously.
432 billion elements: what the figure actually measures
The reference paper describes 2 × 6000³ resolution elements, or approximately 432 billion: one component for gas and one for dark matter. These are the model’s numerical units. A simulated dark-matter particle does not represent a single elementary particle, and a gas cell does not track every atom separately. The parameters are published in the study abstract.
| Reference point | How to read it |
|---|---|
| 500 cMpc per side | The comoving size of the simulated box; the coordinates account for cosmic expansion. |
| Approximately 432 billion elements | Computational units for gas and dark matter, not individual atoms. |
| Down to redshift z = 3 | The simulation follows an early stage and does not extend to the present-day Universe. |
| Galaxies, gas and radiation | Components linked through the laws and approximations included in the model. |
A useful comparison is a digital map: a larger area lets you see rare regions, while better resolution retains local detail. In astronomy, both are needed to follow scarce but influential bright sources alongside more ordinary galaxies.
The IllustrisTNG family of simulations, whose galaxy-formation model underpins the project, explicitly explains this trade-off between volume and resolution. By comparing runs, researchers assess the extent to which results depend on the size of the numerical units.
How galaxies and radiation work together
The Lumina simulation follows matter gathering into structures, gas that can form stars and radiation produced by luminous sources. Radiation transport matters because a source affects regions at a distance as well. The model calculates changes in the gas’s ionization and temperature as it evolves. The team describes this connection in its method overview.
Hydrogen and helium require distinct treatment. Hydrogen has one electron; helium has two. Removing helium’s second electron requires more energetic photons. Sources associated with active supermassive black holes can provide this radiation. That distinction makes it important to include them in a volume large enough to capture their diversity.
For readers, the interesting question is what changes when these processes are computed together. If sources are unevenly distributed, the transformation of gas may be uneven as well. An average for the whole Universe can conceal regions that went through the same process at different times.
Active galactic nuclei are linked to the subject of early quasars observed by Euclid. A rare object can matter greatly precisely because the energy it emits reaches beyond its immediate neighbourhood.
What the Lumina simulation shows — and what remains to be tested
In the computed scenario, hydrogen reionization is dominated by stellar sources, while the late stage of helium ionization is powered by active galactic nuclei. The authors report favourable comparisons with some observational constraints, including measurements related to the cosmic microwave background. These findings are presented in the Lumina study and should be read as predictions and tests of the model.
Agreement with data is valuable, but its strength depends on the question. How well are the observations measured? How many modelling choices can produce a similar result? Does the agreement remain when the observational sample changes? Such questions help distinguish a promising result from an explanation confirmed from several directions.
Lumina therefore provides a basis for comparison. A future mismatch may prove useful: it can indicate where assumptions, the treatment of a process or the interpretation of observations need to be revisited. The striking image begins the discussion; comparable measurements give it weight.
How to read the images without mistaking them for photographs
In the official Lumina gallery, colours can represent gas velocity, matter density or the fraction of an element in a particular state of ionization. The same region can look different when researchers change the property being displayed. The legend is therefore part of the information.
Intense red does not automatically mean a camera would have seen a red region. A visualisation converts numerical values into colours to make them comparable. Before sharing an image, it is worth checking what the scale shows, which moment it represents and whether it is a slice or a projection through a volume.
There is also a difference in perspective. An animation may follow the same computed region at successive moments. A telescope collects the light reaching the instrument now, after journeys of different durations. The link with observation must be built using methods that account for that path, not merely through visual resemblance between two frames.
Why a supercomputer does not eliminate uncertainty
The calculations were run on Frontier at Oak Ridge National Laboratory, according to the MIT presentation. Computing power makes it possible to track a very large number of elements at the same time. It does not automatically turn every approximation into an exact description.
Cosmological simulations still contain processes smaller than the available resolution. Modelling them and carrying out convergence tests are part of the scientific work. IllustrisTNG documentation explains why comparing runs at different resolutions helps assess predictive power. More operations per second and a more reliable explanation are related goals, but they must be assessed separately.
The same criterion is useful when reading about supercomputers such as JUPITER: the decisive question is which problem becomes tractable and how its results can be verified. For cosmology, a large volume is valuable if it produces more demanding comparisons with the observed sky.
Where to explore the Lumina simulation
The public can begin with the project’s gallery. For research, the situation is more nuanced: as documented on 28 October 2026, the data-access page states that the full dataset is not publicly available and invites researchers to request access. Data products and files containing global statistics are presented separately.
One useful way to explore it is to choose a single question: where is the neutral gas, or how do ionized regions change? Follow the same quantity across several frames, then change the visual layer. In this way, the Lumina simulation becomes a tool for understanding beyond the impact of a cosmic image.
Frequently asked questions
Is this real footage of the early Universe?
It is a visualisation made from numerical results. The frames represent the computed evolution of matter and radiation. They can be compared with real observations, but the legend, the model’s assumptions and the size of the simulation must remain part of the explanation.
Does the model also follow the formation of Earth?
The Lumina simulation presented here extends only to redshift z = 3, long before the formation of the Solar System. Its purpose is to investigate the early Universe and reionization, not to reconstruct every planet in detail.
Has it shown exactly how the first galaxies formed?
The project offers a detailed realisation of a physical model and predictions that can be tested. Agreement with some observations supports the model’s usefulness, but does not settle every question about sources, gas or numerical approximations.
Can I download all the data to my personal computer?
The official page distinguishes between statistics made available for consultation and full datasets, for which access must be requested. It is worth first checking which product addresses the question at hand; a public animation, a statistical curve and a complete numerical volume serve very different purposes.
Sources and further reading
- Zier and colleagues — Introducing the Lumina project, MNRAS — 2026-10-26.
- MIT Kavli — Watch the universe emerge from the dark ages, with Lumina — 2026-10-26.
- Lumina Collaboration — Project description — accessed 2026-10-28.
- Lumina Collaboration — Media gallery — accessed 2026-10-28.
- Lumina Collaboration — Data access — accessed 2026-10-28.
- NASA — What Were the First Stars Like? — accessed 2026-10-28.
- IllustrisTNG — Project description — accessed 2026-10-28.
Representative image: AI-generated editorial illustration for InfoBuz.


Discuția cititorilor
Ai o opinie sau o întrebare despre acest articol? Spune-ne ce crezi.
Fii primul care deschide discuția.
Te rugăm să păstrezi un limbaj civilizat și să discuți la subiect. Comentariile spam sunt filtrate automat.