
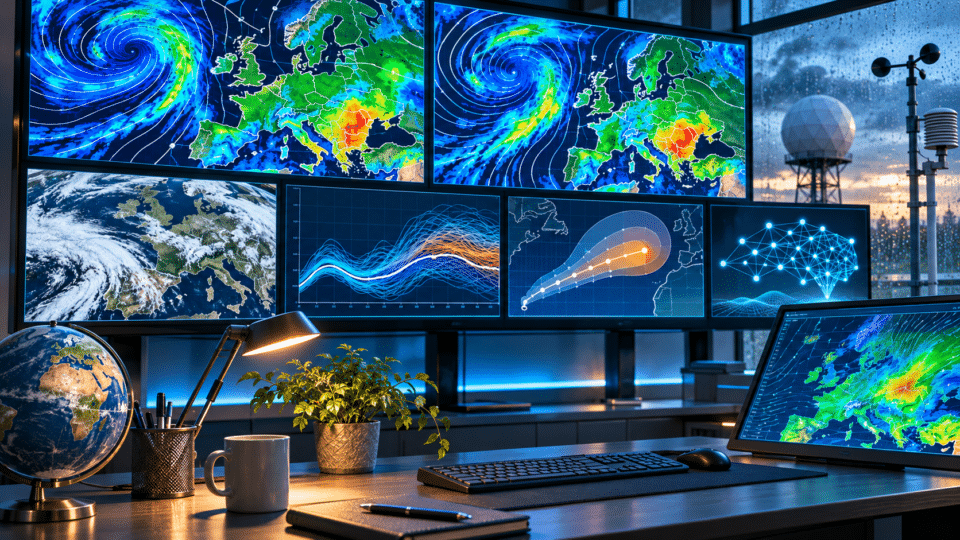
Why do weather forecasts change from one day to the next? Because the atmosphere is a chaotic system, and every forecast is a simulation based on the best available estimate of the atmosphere’s current state. When new observations arrive, the model is run again, and very small differences in temperature, humidity, pressure or wind can alter a front’s track, the timing of rainfall or the estimated amount of precipitation several days ahead.
That does not mean “meteorologists do not know the weather”. It means that a forecast is a probabilistic estimate of the future, not a snapshot of tomorrow that has already been taken. The further ahead we look, the more small uncertainties in the present are amplified.
This InfoBuz article was updated on 2 November 2026, based on official documentation from ECMWF, NOAA/NCEP and the Met Office. ECMWF currently operates both the physics-based IFS model and the AI-based AIFS forecasting system, while NOAA runs GFS four times a day out to 16 days.
For current weather data and the LIVE tools available on the site, see InfoBuz’s guide How to use InfoBuz LIVE data: weather, traffic, fuel prices and exchange rates.
Why weather forecasts change: the 30-second answer
| Reason | What happens |
|---|---|
| The atmosphere is chaotic | Very small differences at the start can lead to different outcomes after a few days. |
| New observations arrive | Satellites, radar, weather stations and weather balloons update the initial state. |
| Models are run again | ECMWF, GFS and other models run multiple cycles every day. |
| Models are not identical | They use different resolutions, equations, parameterisations and data-assimilation methods. |
| Apps post-process the data | Two apps can use the same model yet still show slightly different values. |
| Local forecasts are harder | Showers, fog, sea breezes and storms can vary over short distances. |
A weather forecast starts with the question: “What does the atmosphere look like right now?”
Before a model can calculate tomorrow’s weather, it needs to know as accurately as possible what is happening now. That means millions of observations from satellites, weather stations, aircraft, ships, buoys, radar, radiosondes and other systems.
For further context, see Thwaites Glacier could reshape the world’s coastlines: what is happening beneath the ice, an article that develops an aspect directly related to this subject.
The problem is that it is not possible to measure every cubic metre of air above the planet. There are gaps between observations, and some measurements have their own errors. Weather centres therefore use data assimilation: they combine real-world observations with an earlier estimate of the atmosphere to obtain the best possible initial state.
ECMWF and NOAA use advanced assimilation systems. NOAA says its Global Data Assimilation System, GDAS, produces GFS initial conditions using a hybrid ensemble-variational system. See NOAA/NCEP’s official GFS description.
The atmosphere is “chaotic”: what that actually means
In meteorology, “chaotic” does not mean ruleless. The atmosphere follows the laws of physics, but it is extremely sensitive to initial conditions. Two simulations that begin almost identically can remain close for a while and then diverge sharply.
The Met Office explains this clearly: small differences in temperature, wind or humidity in the initial state can eventually produce major differences in a forecast after several days. The longer the lead time, the greater the uncertainty.
This is why an app may show rain for Saturday on Monday, only cloud on Tuesday, then return to rain on Wednesday. It is not necessarily a “corrected mistake”, but an evolution in the most likely scenario as new information becomes available.
What is ECMWF, and why is it watched so closely?
ECMWF is the European Centre for Medium-Range Weather Forecasts. Its main physics-based system is called the Integrated Forecasting System (IFS), which models the atmosphere together with other components of the Earth system.
For medium-range forecasting, ECMWF runs an ensemble of 51 simulations: one control run and 50 members with small perturbations to initial conditions and to the representation of some physical processes. Its horizontal resolution is around 9 km, and the forecast extends to 15 days. Official documentation is available on the ECMWF medium-range forecasts page.
One important point: what users simply call “ECMWF” may refer to different products — a deterministic run, an ensemble, the ensemble mean, probabilities or post-processed products. That is why two websites that say they use ECMWF can display different forecasts.
What is GFS, and why does it appear in almost every weather app?
GFS, or the Global Forecast System, is NOAA/NCEP’s operational global model in the United States. It is among the world’s most widely used models because its data are broadly accessible and incorporated into many apps, websites and weather services.
According to NOAA, GFS runs four times a day and produces forecasts out to 16 days. The operational model has a nominal resolution of roughly 13 km and 127 vertical levels. Its main cycles are 00, 06, 12 and 18 UTC.
The fact that GFS updates four times a day helps explain why a website can change its forecast within the same day: it may not be comparing the same simulation in the morning and in the evening.
ECMWF vs GFS: which is better?
The question is common, but the accurate answer is: there is no outright winner in every situation. ECMWF is recognised for very strong performance in global medium-range forecasting, but GFS can have forecast cycles or situations in which it captures a particular phenomenon better.
More important than asking “which model is better” is whether independent models converge on the same scenario. If ECMWF, GFS and their ensembles show a similar evolution, confidence rises. If one shifts a cyclone north, another south, and the ensembles are widely spread, uncertainty is high.
ECMWF notes that forecasting systems differ in their models, data-assimilation methods and representation of uncertainty. This is precisely why multi-model projects such as TIGGE are useful for comparing agreement and divergence between centres.
What is an ensemble forecast, and why is it more valuable than a single “map”?
A deterministic run provides one possible future. An ensemble runs the model many times with slightly different initial conditions and, in some cases, variations in how the model represents physical processes.
If 45 of 51 ECMWF members show rain in a region and six do not, the signal is relatively strong. If only 20 show rain and the rest are very different, confidence is lower.
The Met Office explains ensembles in exactly these terms: if members remain tightly grouped, the forecast has greater confidence; if they spread out, several possible scenarios exist. See its official guide to ensemble forecasting.
Why is a two-day forecast better than a 10-day forecast?
Over the short term, initial errors have not had much time to grow. Large-scale features — fronts, cyclones and air masses — are also already observable, and their position can be tracked.
After roughly five to seven days, small differences between scenarios become increasingly important. At 10 to 15 days, models can offer useful information about the trend, but details such as “it will rain at 5pm in Constanța” should not be treated with the same confidence as a forecast for tomorrow.
| Time range | What is worth following | Typical level of useful detail |
|---|---|---|
| 0–48 hours | Radar, satellite, short-range models | Hours, location, temperature, wind and rain |
| 3–5 days | Global models and ensembles | Fairly stable day-by-day evolution |
| 6–10 days | Ensembles and agreement between models | Trends and ranges, rather than fine detail |
| 11–15 days | Probabilities and atmospheric regime | Mainly trends: colder, warmer or wetter |
| Beyond 15 days | Extended and seasonal forecasts | Anomalies and probabilities, not exact weather on a particular street |
Why is rain harder to forecast than temperature?
Temperature on a regional scale changes relatively smoothly. Precipitation can be far more localised. A convective cell may drop 20–30 mm in one municipality and almost nothing a few kilometres away.
A global model with a 9–13 km grid does not “see” every individual cloud. It represents processes smaller than the grid through parameterisations. Higher-resolution regional models can simulate convection, terrain and local breezes better, but even they cannot state perfectly where every shower will form.
What does a 60% chance of rain mean?
The precipitation percentage shown in an app should not automatically be read as “it will rain for 60% of the day” or “it will rain across 60% of the city”. In general, it represents the probability that measurable precipitation will occur at the location or in the area for which the forecast is calculated, during a given period.
The exact definition can vary between providers. It is therefore useful to check the estimated amount, the time window and the distribution of probability, rather than looking only at the cloud icon and percentage.
Why do two weather apps show different temperatures for the same place?
- They use different models;
- they have taken different runs of the same model;
- they use different methods to interpolate between grid points;
- they correct the model against local observations differently;
- they use different elevations for the representative point;
- they round values differently;
- they update their databases at different times.
Elevation is an important detail. If a model grid point “sees” an elevation of 250 metres but the actual town is at 80 metres, the raw temperature needs correction. Weather services carry out this post-processing differently.
Why can a forecast change abruptly after a new model run?
Sometimes models remain stable for several cycles and then “jump” to another scenario. There are usually one of three explanations: new observations changed the initial state; an important atmospheric feature was analysed differently; or the ensemble began favouring another cluster of scenarios.
Such changes are common when there is a Mediterranean cyclone, a wavy front or an atmospheric blocking pattern. A shift of 100–200 km can move the main rain or snow band entirely.
Why can local forecasts be harder along the coast and in Dobruja?
In coastal areas, interaction between sea and land can alter wind, moisture, temperature and cloud formation on a small scale. A sea breeze can change wind direction within a few hours, while the Black Sea can supply additional moisture in certain synoptic configurations.
In Dobruja, where drought and highly uneven rainfall distribution matter, a few dozen kilometres can make the difference between an area receiving substantial rain and one remaining almost dry. InfoBuz examined this separately in the article Soil drought in the middle of autumn: why Dobruja’s soil remains dry.
What is nowcasting, and why can it sometimes beat yesterday’s forecast?
Nowcasting deals with the coming minutes and hours, making intensive use of radar, satellite imagery, lightning data and real-time observations. If you want to know whether a storm will reach a city in the next 60–90 minutes, radar and nowcasting can be more useful than a forecast calculated 12 hours earlier.
This is why weather warnings and nowcast messages can appear or rapidly alter an apparently calm forecast. A convective storm can develop faster than a static automated forecast can capture it.
Artificial intelligence has already entered weather forecasting
In February 2025, ECMWF launched the first operational version of its Artificial Intelligence Forecasting System (AIFS), and in July 2025 it also introduced an ensemble version. AIFS uses machine learning to produce global forecasts much faster than traditional numerical models.
ECMWF nevertheless continues to run the physics-based IFS models in parallel. AI does not remove the atmosphere’s fundamental uncertainty. It can learn relationships from vast volumes of data and produce highly efficient simulations, but forecasting still depends on initial conditions and the probability of multiple scenarios.
ECMWF describes the IFS and AIFS systems on its official About our forecasts page.
Why you should not be alarmed by an extreme map 10–15 days ahead
Social media frequently features screenshots claiming “-20°C in two weeks”, a “devastating cyclone” or “50 cm of snow on an exact date”. A single long-range deterministic run is not a certain forecast.
The Met Office explicitly warns against headlines promising an exact date for weather events several weeks away. At those lead times, the relevant things to watch are ensembles, probabilities and whether a signal persists from one run to the next — not one dramatic map.
How to judge the confidence you should place in a forecast
- Consider the lead time. A 48-hour forecast and a 10-day forecast do not have the same level of confidence.
- Compare two independent models, rather than two apps that may use the same source.
- Follow the ensemble if you have access to it.
- Check whether the scenario persists across two or three consecutive runs.
- For approaching rain and storms, check radar and official warnings.
- Do not take an exact long-range value literally. The range and the trend matter.
- For safety decisions, use ANM and official warnings, not only a commercial app.
Myth: “If the forecast changed, the first one must have been wrong”
Not necessarily. The forecast from three days ago was the most likely estimate based on the data available then. Today’s forecast uses new information. If probability has shifted towards another scenario, the forecast should change.
A good forecast is not one that refuses to change. It is one that updates when the evidence changes and accurately expresses its level of confidence.
Frequently asked questions about ECMWF, GFS and weather forecasts
Why do ECMWF and GFS show different weather?
They are different models, with distinct assimilation methods, physics, resolution and initial conditions. Differences are normal, especially at longer lead times.
Which weather model is best?
No model is perfect for every situation. ECMWF performs very well globally at medium range, but it is most useful to follow agreement between models and ensembles.
Why does the weekend forecast change?
Because uncertainty is already greater at five to seven days. A small shift in the track of a front or cyclone can move rain by hundreds of kilometres or by 12–24 hours.
Is the 14-day forecast useless?
No. It is useful for trends and probabilities, but it should not be read as an exact promise for a particular hour and place.
Why do my phone app and ANM not show exactly the same forecast?
They may use different models, cycles and post-processing methods. ANM also adds operational expertise and issues Romania’s official warnings.
Will AI make weather forecasting perfect?
No. AI can improve forecast speed and performance, but it does not eliminate the chaotic nature of the atmosphere or uncertainty in initial conditions.
Conclusion: a changing forecast is a sign of a system receiving new information
Why does the weather forecast change from one day to the next? Because the atmosphere has several possible paths of development, and models are continually updated with new observations. ECMWF, GFS and other systems are not trying to “guess”; they solve equations or use AI models to calculate the most likely future states.
In the short term, scenarios tend to converge and the forecast becomes more stable. At longer range, ensembles spread out and it is necessary to speak more about probabilities than certainties. The most useful rule for users is simple: short range = details; long range = trends and probabilities.


Discuția cititorilor
Ai o opinie sau o întrebare despre acest articol? Spune-ne ce crezi.
Fii primul care deschide discuția.
Te rugăm să păstrezi un limbaj civilizat și să discuți la subiect. Comentariile spam sunt filtrate automat.