
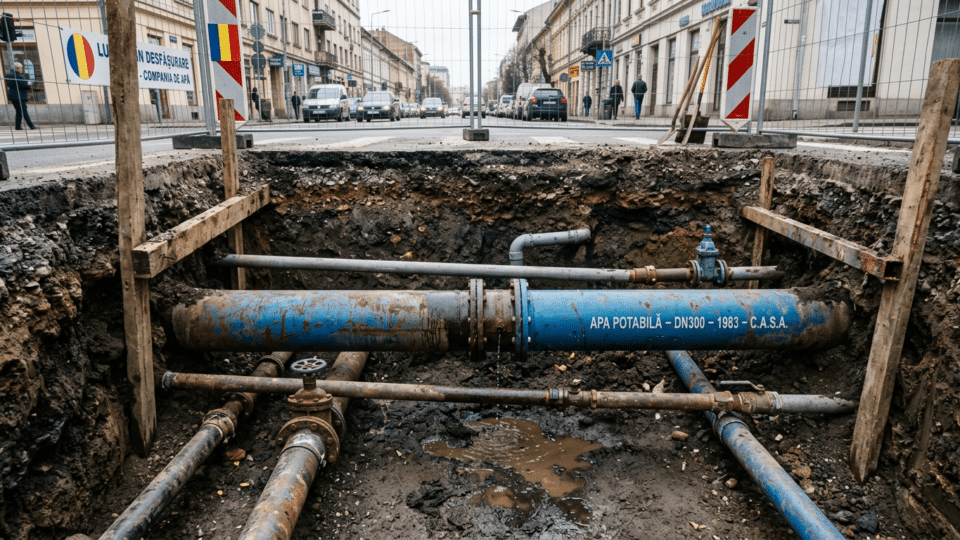
In 2024, 44% of the water reported by the group of operators analysed by ANRSC was “water that does not generate revenue”. The proportion helps explain why ageing pipes, breakdowns and investment are recurring topics in Romanian cities. But the percentage cannot accurately be translated into the simple claim that “44% of drinking water leaks into the ground”.
In technical terms, non-revenue water does include physical leaks from pipes, reservoirs and service connections. It also includes water consumed legally but not billed, meter errors, unauthorised consumption and accounting discrepancies. That distinction changes both the diagnosis and the discussion of costs borne by users.
In brief: Romania has a high reported level of water that does not generate revenue, but the publicly available data do not allow the volume that physically leaks away to be separated, at national level, from all the other components of the indicator.
What non-revenue water actually measures in Romania
The 2024 performance report of the National Regulatory Authority for Community Public Utility Services (ANRSC) puts the “water that does not generate revenue” indicator at 44% for the group of operators analysed. The report shows a substantial difference between categories: 50% for major regional operators and 27% for large municipal operators.
The figure refers to operators included in ANRSC’s benchmarking analysis. In this form, it is not a direct and uniform measurement of every litre distributed by all water systems in Romania.
Under the methodology commonly used internationally, including in World Bank documentation, water that does not generate revenue is the difference between water entering the system and billed authorised consumption. It can have three components:
- unbilled authorised consumption — for example, certain operational uses, pipe flushing, emergency work or permitted public uses;
- apparent losses — metering errors, unauthorised consumption or shortcomings in record-keeping;
- real losses — leaks from pipes, reservoirs and service connections, up to the metering point.
Only the last category literally describes water that leaves the network before it can be used or measured by the customer. A burst pipe may therefore be an important part of the problem, but it is not the only possible explanation for high non-revenue water (NRW).
Why the 44% figure cannot be turned into a bill for waste
For 2024, the ANRSC report gives an average monthly household bill of 74 lei for the group analysed. It may be tempting to say that 44% of that amount represents water lost. That would be incorrect.
In proportions that vary from one operator to another, the bill covers abstraction, treatment, pumping energy, transport, distribution, wastewater collection and treatment, staffing, maintenance, investment, and other contractual or local obligations. Moreover, the non-revenue water percentage does not show what it cost to produce that volume, or what share of that cost was accepted in the tariff.
Romanian law treats losses that may be included in the price-setting calculation separately. The tariff methodology published on the Legislative Portal provides for justified losses to be approved annually, based on the water balance for each supply system. Where total losses exceed 20%, flow and pressure measurements are required on segments or control sections.
The ANRSC benchmarking indicator and the losses accepted in tariff-setting are therefore related, but are not automatically the same thing. The documents reviewed contain no simple public formula allowing every household to determine “how many lei on the bill go towards lost water”.
Non-revenue water in Romania: the same label, but data that do not mean exactly the same thing
A fair comparison between operators requires more than placing percentages side by side. The year, service area, point in the system at which the volume is measured, formula used and separation of components all need to be checked. Public documents from several operators illustrate the difficulty.
| Source / area | Year | Published indicator | What can be said with certainty | Comparison limit |
|---|---|---|---|---|
| ANRSC, group analysed | 2024 | 44% water that does not generate revenue | An aggregate indicator for operators included in the benchmarking exercise; 50% for major regional operators and 27% for large municipal operators. | The same national table does not publish a complete, uniform breakdown into real losses, apparent losses and unbilled authorised consumption. |
| Apa Canal Galați | 2024 | 45.07% NRW; 54.93% recovery rate | The operator reports two complementary indicators for its own service area. | This is the operator’s own reporting; comparison requires checking the technical formula and underlying volumes. |
| Aquatim | 2024 | 41.1% NRW target | The sustainability report separates 10.4% operational consumption and 30.4% losses in transport and distribution. | This is a reported target, not automatically equivalent to an annual NRW result comparable with the other two figures. |
| Hidro Prahova | 2023–2025 | Values above 53% reported from an audit | The Court of Accounts published the webpage for its 2026 compliance audit report. | The percentages and detailed methodology should be checked directly in the full report before a firm numerical comparison is made. |
In Galați, the 2024 annual report of Apa Canal gives NRW of 45.07% and a recovery rate of 54.93%. The terms appear complementary, but they must be interpreted within the operator’s definitions, rather than automatically turned into a verdict on the physical condition of its pipes.
In Timișoara, Aquatim’s sustainability report provides useful transparency on the components monitored: for its 41.1% target for water that does not generate revenue, it lists 10.4% operational consumption and 30.4% losses in transport and the distribution network. The breakdown shows why a single percentage can conceal different mechanisms. The report also cites network sectorisation, flow and pressure monitoring, leak detection and smart metering as control tools.
Importantly, 10.4% and 30.4% should not be mechanically added together to “correct” the 41.1% target. The document must be read according to its own definitions and rounding, and 41.1% remains the figure communicated by the operator.
A local audit may signal a serious problem, but it does not describe the whole country
The Romanian Court of Accounts webpage for the Hidro Prahova audit report confirms the publication, on 16 September 2026, of a document dated 28 August 2026. Local reports based on the audit indicated figures above 53% in 2023, 2024 and 2025.
The case is relevant as a warning about the scale the problem can reach in a regional service area. It does not, however, demonstrate that Romania “loses 53%” of its water, nor does it show — without a detailed water balance — what proportion is accounted for by physical leaks as opposed to imperfect measurement, unbilled consumption or other accounting discrepancies. The full audit file must be consulted before exact percentages and causes can be cited as definitive technical details.
To complement the information above, see also The Black Sea has tides, but wind hides them: why Romania’s coast is unlike the Atlantic, an article that explores an aspect directly related to this subject.
Repeated construction work is not the only tool against losses
Replacing pipes is necessary in many networks, but it cannot alone resolve the gap between water produced and water billed. A network may have leaks that are difficult to locate, excessive pressure on certain sections, problematic service connections, ageing meters, or areas where flows are not measured accurately enough.
A serious loss-reduction programme therefore generally combines physical rehabilitation with dividing the network into measurable zones, pressure monitoring, active leak detection, meter testing and updating the water balance. Kilometres of rehabilitated pipes measure investment effort; on their own, they do not prove that the non-revenue water indicator has fallen.
A credible assessment should compare the same technical service area before and after work enters operation, using the same calculation formula. Otherwise, a change may also result from an expanded service area, changes in consumption, better metering or a change in reporting methods.
What a customer can check with the local operator
A customer cannot identify losses in the city network from their bill, but can look for documents showing whether the operator describes the problem with sufficient precision. The most useful are the annual report, strategy or business plan, tariff-adjustment documents, and decisions by local or county authorities approving investments.
- Are the volume of water entering the system and the volume billed published for the same year?
- Does the operator distinguish between real losses, apparent losses and unbilled authorised consumption?
- Is there a water balance by locality or pressure zone, rather than only an average for the whole county?
- Are post-investment results explained through comparable time series, rather than solely by the number of kilometres rehabilitated?
- Are the measurement methods and limitations of the data specified?
These questions also matter for day-to-day service. A large, persistent leak can mean additional treatment and pumping costs, unstable pressure, more frequent interventions and greater vulnerability to failures. Yet measurement transparency is as important as repair work: without it, it is impossible to establish whether a project genuinely reduced losses or merely changed the reported figure.
The conclusion supported by the data is therefore more nuanced than the phrase “water disappears before the tap”. The 44% indicator shows a large gap between water entering the system and water that generates revenue. To determine how much of that gap is actually lost through pipes — and what results investment delivers — operators and the regulator need to publish comparable water balances with verifiable definitions and volumes.
Frequently asked questions
Does 44% non-revenue water mean that 44% of the water leaks from pipes?
No. The indicator may include real losses from pipes, but also unbilled authorised consumption, metering errors, unauthorised consumption or accounting discrepancies. The public data reviewed do not allow these components to be separated uniformly at national level.
Can I calculate what I pay for lost water by multiplying my bill by 44%?
No. The tariff includes several costs of water and sewerage services, while non-revenue water is not the same as physical loss. The water balance, costs recognised in the tariff and the cost structure of the local operator would be needed.
Why can two operators have different percentages without one automatically being more efficient?
The percentages may reflect network length and density, the share of rural localities, meter quality, operational consumption, service area and the reporting formula. A valid comparison requires the same period, the same definition and the same underlying volumes.
Sources consulted
- ANRSC — Performance analysis report on Romania’s water and wastewater operators and the effects of economic regulation, 2024
- Aquatim — 2024 Sustainability Report
- Apa Canal Galați — 2024 Annual Report
- Legislative Portal — Methodology for setting, adjusting or amending prices and tariffs for water services
- Romanian Court of Accounts — Compliance audit report No. 58796/28 August 2026, SC Hidro Prahova SA


Discuția cititorilor
Ai o opinie sau o întrebare despre acest articol? Spune-ne ce crezi.
Fii primul care deschide discuția.
Te rugăm să păstrezi un limbaj civilizat și să discuți la subiect. Comentariile spam sunt filtrate automat.