
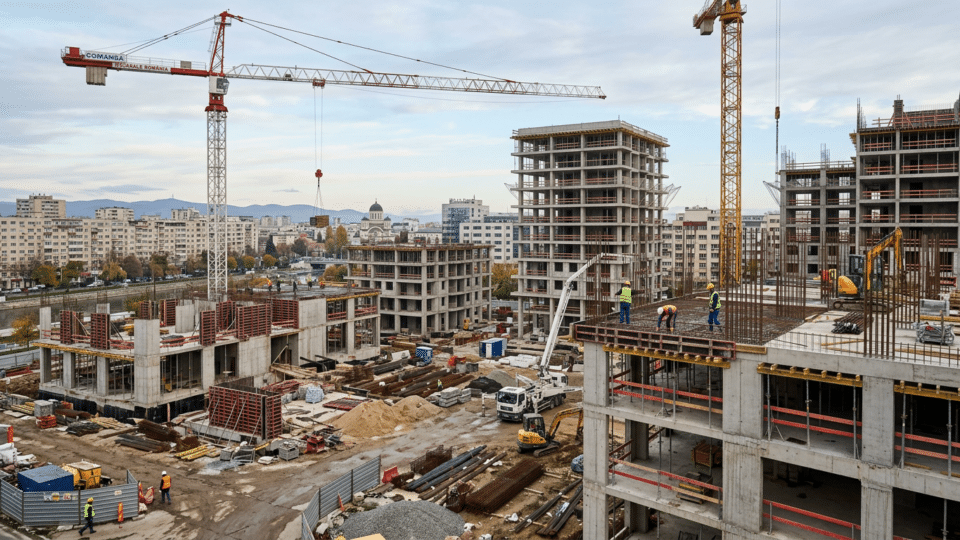
Construction activity in Romania did not decline in July 2026 compared with June. Eurostat data published on Thursday, 18 September 2026, show month-on-month growth of 1.5%, after calendar and seasonal adjustment. Data from the National Institute of Statistics (INS), as reported from the release published the same day, point in the same direction: +1.4% in the adjusted series. The notion of a slight decline in July must therefore be corrected.
The annual picture is less straightforward. Eurostat reports 1.8% growth for Romania in July 2026 compared with July 2025, while INS data presented by the business press indicate an 8.3% decline in the adjusted series. The two results should not be conflated and do not, at this stage, allow a categorical conclusion that all construction sites have either accelerated or slowed down.
For more information on Romania’s economy, see also Inflation reached 10.7%: why Romanians are paying more even as wages fail to keep pace, which provides complementary details on the subject.
What the confirmed July data show
In the Eurostat series, Romania’s seasonally adjusted construction production index rose from 157.4 points in June to 159.7 points in July, with 2021=100 as the base year. A calculation using the published levels confirms a change of around 1.46%, rounded by Eurostat to 1.5%.
The reported INS series for July shows adjusted growth of 1.4% compared with June. In unadjusted data, the increase is larger, at 7.6%, but this comparison includes seasonal effects and a different number of working days. In construction, where weather, holidays, the scheduling of public investment and the pace of invoicing can significantly shift activity between months, the adjusted series is more suitable for the simple question: “was more or less work carried out than in the previous month?”
| Comparison | Eurostat | INS, according to data reported from the release | Cautious interpretation |
|---|---|---|---|
| July 2026 compared with June 2026 | +1.5% | +1.4% adjusted; +7.6% unadjusted | Activity increased from one month to the next. |
| July 2026 compared with July 2025 | +1.8% | -8.3% adjusted; +2.0% unadjusted | The published series provide divergent signals and should be read with methodology and possible revisions in mind. |
| January–July 2026 compared with the same period of 2025 | Not the indicator covered by Eurostat’s monthly release | +8.2% adjusted; +11.2% unadjusted | The first seven months point to a higher level of activity than last year. |
Frequently cited annual growth does not automatically describe all types of work
INS data for the first seven months show an 8.2% increase in the volume of construction work, in the adjusted series, compared with January–July 2025. New construction made the largest contribution, at +13.4%. By type of structure, residential buildings rose by 17.9%, civil engineering construction by 8.4%, and non-residential buildings by 7.2%.
This composition matters. Civil engineering works broadly include transport and utility infrastructure, networks, hydrotechnical works, and other public or general-interest projects. Growth in this area can sustain demand for crews, machinery and materials even if the housing market develops differently from city to city.
At the same time, residential growth in the first seven months does not automatically mean that every buyer will see more completed apartments or lower prices. The indicator measures the volume of work carried out, adjusted for prices; it does not measure the number of homes sold, permits issued, developers’ margins or the affordability of loans.
Infrastructure can support construction sites, but does not eliminate the risk of delays
The pace of civil engineering construction is relevant to public projects, from roads and networks to urban rehabilitation. A greater volume of work carried out may mean that contracts are genuinely under way, rather than merely announced projects. For contractors and skilled workers, this tends to support continuity of activity.
However, national statistics do not say how many projects are on schedule, how many face funding problems, how many are blocked by expropriations, utilities or challenges, or which counties benefit most. A commune or municipality may face delays even during a period when the national indicator is rising. The same principle applies to thermal renovation work, schools, hospitals and investment in networks.
In addition, Law No. 141 of 13 July 2026 introduced temporary measures to accelerate certain public construction investments, including mechanisms related to final acceptance of works and phased settlement of payments. The law’s effect on the physical volume of work cannot yet be separated out in the July data, but the framework may reduce some administrative bottlenecks for eligible projects.
What this could mean for jobs
Sustained growth in the volume of work is normally a favourable signal for demand for tradespeople, technical staff, drivers, machinery operators and subcontractors. But the production index is not a direct employment indicator: companies can carry out more work with the same workforce, through subcontracting, overtime or more productive machinery.
For employees, the useful signal is that the first seven months remained above the level of the comparable period in 2025, and that new construction and civil engineering works contributed to the increase. For small firms, the practical risk remains the gap between contracted work and payments received on time. Higher statistical volume does not automatically mean better liquidity for every contractor.
Readers interested in the labour market can compare this trend with data on job vacancies and sought-after trades in Romania. Employer-reported demand and the volume of work are different indicators, but together they provide a closer picture of market conditions.
Prices: higher activity does not automatically mean more expensive homes
It is tempting to conclude that more construction sites inevitably lead to higher prices. The relationship is indirect, however. The final price of a home depends on land, financing, materials, wages, local demand, competing supply, taxes and the developer’s margin. For public projects, contract indexation, the available budget and the payment schedule also matter.
There is, however, a context worth following: Eurostat shows that producer prices for new residential buildings in Romania rose by 130.7% between 2015 and 2025, one of the largest increases in the European Union. This describes an accumulation of costs over the past decade, not a forecast for prices in autumn 2026.
For current project costs, companies need to track materials, energy, wages and transport separately. Developments at the pump can affect logistics and machinery costs, and InfoBuz’s page on fuel prices in Romania may be useful as a practical reference, without replacing the contractual cost calculation for each construction site.
Why Eurostat and INS can produce such different annual results
The difference between the +1.8% reported by Eurostat and the -8.3% reported from the INS release for the July 2026–July 2025 comparison is too large to ignore. It may relate to the version of the series, adjustments and the way indicators are presented, but the documents reviewed do not allow one single explanation to be established with certainty.
What can be said without speculation is that the monthly results are close: +1.5% in Eurostat and +1.4% in the adjusted INS series. For the annual comparison, however, readers should check the series and update date before using a figure in a tender, local budget or market analysis. Eurostat explicitly warns that monthly data may be revised and that European aggregates may include estimates for missing observations.
What these data do not show
- They do not show how many homes were completed or sold in July.
- They do not show how many people were hired or laid off in construction.
- They do not allow a direct estimate of the price of an apartment, a house or a public contract.
- They do not show the situation in every county, city or construction site.
- They do not prove that a particular public project will be completed on time.
The useful conclusion is more nuanced than a headline built around a single percentage: in July, construction activity increased compared with June, and the balance for the first seven months remains positive. But for the comparison with July 2025, published series show divergent results. Until there is methodological clarification or possible revisions, the most responsible reading is that the sector is still moving at a high pace in 2026, but not uniformly and not clearly enough to support firm forecasts about all construction sites, jobs or prices.
Frequently asked questions
Did construction in Romania decline in July 2026 compared with June?
No. Eurostat indicates growth of 1.5%, while the calendar- and seasonally adjusted INS series indicates +1.4%.
Which sectors supported construction in the first seven months of 2026?
According to INS data reported from the 18 September 2026 release, new construction work recorded the largest increase. By type of structure, residential buildings posted the biggest gain, followed by civil engineering construction and non-residential buildings.
Does higher construction activity mean homes will become cheaper or more expensive?
Not directly. The index measures the volume of work, not the selling price of homes. The latter also depends on land, lending, costs, demand, supply and developers’ margins.
Why does the Eurostat annual figure differ from the one reported from the INS release?
The sources reviewed confirm the difference, but do not provide a single, fully verifiable explanation for it. Before using the figures in an analysis or decision, the exact series, applied adjustments and any revisions must be checked.









Discuția cititorilor
Ai o opinie sau o întrebare despre acest articol? Spune-ne ce crezi.
Fii primul care deschide discuția.
Te rugăm să păstrezi un limbaj civilizat și să discuți la subiect. Comentariile spam sunt filtrate automat.