
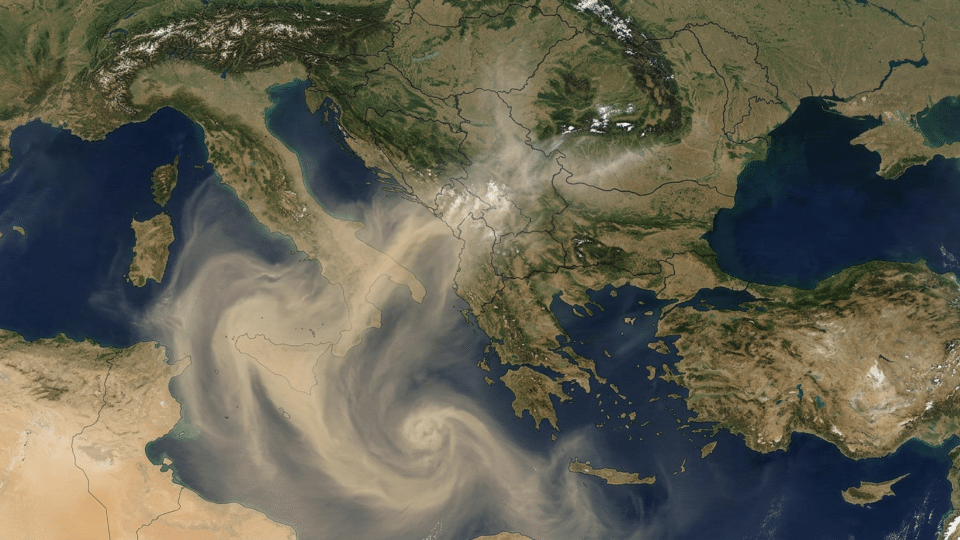
Between 23 and 27 March 2025, Romania’s National Meteorological Administration (ANM) announced that dust of Saharan origin was being transported towards south-eastern Europe and over southern Romania. The practical explanation for cars marked after rain is straightforward: particles were carried long distances by the wind, and precipitation “washed” them out of the atmosphere onto windows, car bodies and balconies. The less intuitive point is that a rise in PM10 at a monitoring station in Romania does not, by itself, prove that the dust came from the Sahara.
A monitoring station measures the mass of particles in the air around it. A CAMS map shows, based on observations and atmospheric models, where dust aerosols are likely to move. To responsibly conclude that a PM10 episode had a Saharan contribution, these two types of information must be read together, alongside wind direction, rainfall and the type of station.
Saharan dust in Romania: the journey starts with wind, not rain
The Sahara is a very large source of mineral aerosols: dry soil particles lifted by strong winds. If atmospheric circulation is favourable, some of them rise into the troposphere and can remain suspended for days or even weeks. Air currents can then carry them across the Mediterranean, through southern Europe and towards Romania.
During the March 2025 episode, ANM explicitly indicated predominantly south-westerly circulation—the very direction capable of bringing to Romania an air mass originating in North Africa. Its statement of 22 March 2025 also made an essential distinction: deposits were expected to be visible mainly during periods of rain. The maps published by ANM for that episode tracked the air mass’s evolution between 23 and 27 March.
Rain does not produce Saharan dust, nor does it bring it from the Sahara. It makes it visible on the ground. Raindrops capture some of the suspended particles and, after the water evaporates, a beige, yellow or reddish-brown film remains. Ordinary rain can also leave traces of local dust, pollen or urban particles, so the appearance of a deposit is an indication, not a laboratory analysis.
What CAMS sees and what an RNMCA station sees
CAMS, the European Copernicus Atmosphere Monitoring Service, tracks aerosol transport using satellite observations, ground-based data and atmospheric-composition forecasting models. Its maps include, among other indicators, aerosol optical depth (AOD, an indicator of the optical aerosol loading in the air column) and surface-dust estimates. CAMS notes that its analyses combine satellite observations with the IFS-COMPO model and, for Europe, also use an ensemble of air-quality models.
Romania’s National Air Quality Monitoring Network (RNMCA), available through the official Calitatea Aer platform, makes a different kind of observation: it measures pollutants at fixed locations in Romania. Published values are updated hourly and are undergoing validation and certification. They are therefore extremely useful for showing what happened near a particular station, but they do not automatically provide a complete map of a county or region.
| Question | CAMS maps | RNMCA stations |
|---|---|---|
| What can they show well? | The likely origin, movement and regional extent of an aerosol plume. | Locally measured concentrations of PM10, PM2.5 and other available pollutants. |
| What can they not prove on their own? | The exact value breathed in on every street, or the composition of deposits on a car. | The geographical origin of every particle in the air sample. |
| Their role in a Saharan episode | They confirm whether a plausible atmospheric route exists from North Africa to Romania. | They show whether the episode coincided with a real increase in particles at ground level. |
This is why the phrase “high PM10 because of the Sahara” should be used cautiously. PM10 means particles with an aerodynamic diameter of no more than 10 micrometres; the indicator describes the size and mass of measured particles, not their chemical composition or where they came from. During the same period, a station may simultaneously capture transported mineral dust, traffic emissions, smoke from heating, construction dust or particles resuspended from the road surface.
Why station type changes the interpretation of a PM10 value
Not all stations answer the same question. RNMCA classifies monitoring sites according to the influence they are intended to capture. A traffic station has a representative area of roughly 10–100 metres and is designed to observe the effect of nearby traffic. An urban-background station broadly represents conditions over an area of 1–5 kilometres. Regional stations have much wider representativeness, of around 200–500 kilometres, while EMEP stations are also intended to assess long-range transboundary pollution.
Therefore, if, on a day with Saharan transport, a traffic station records a higher PM10 peak than an urban-background station, the difference does not prove that Saharan dust bypassed the surrounding neighbourhoods. It may also show the additional contribution of traffic, road-dust resuspension or a source very close by. The official description of station types is available on the RNMCA page dedicated to the monitoring network.
By contrast, a relatively simultaneous rise in PM10 at stations in different areas, including some regional-background or EMEP stations, together with a CAMS map showing dust transport towards Romania, is stronger evidence of a regional contribution. Even this match, however, cannot numerically separate—without further analysis—how many micrograms come from mineral dust and how many from local sources.
For further context, see Why does a compass not point to geographic north? In Romania, the difference is about 6–7 degrees, an article that develops an aspect directly related to this subject.
How to read the 23–27 March 2025 episode correctly
This episode provides a useful example of method, not permission to retrospectively attribute every PM10 exceedance to African dust. ANM documented the likely trajectory of an air mass laden with particles from North Africa towards southern Romania. CAMS later reported that, in the first months of 2025, there had been several long-range Saharan dust transports towards Europe, with significant effects on coarse particles, including PM10.
What should have been compared for a rigorous local attribution?
- Time window: hourly values and daily PM10 averages from 23–27 March 2025, not just the index colour at a single hour.
- Geographical distribution: stations in the south, south-east and other regions, to establish whether the signal was widespread or localised.
- Station type: comparison of traffic and urban-background stations and, where data are available, regional-background or EMEP stations.
- Co-pollutants: a peak dominated by particles, without a comparable increase in nitrogen dioxide, is more consistent with a dust contribution than a peak closely linked to traffic; however, it is not definitive proof.
- Local meteorology: wind, precipitation, humidity and atmospheric stability can increase, deposit or disperse particles.
An important limitation is that the RNMCA public page provides rapid data, but communicates them as values undergoing validation and certification. For an administrative or scientific conclusion on exceedances, sources and natural contributions, analysis of validated data and, in some cases, modelling or chemical characterisation are needed. The European Union recognises Saharan dust among the natural sources that can contribute to PM10, but that possibility does not automatically make every episode of high PM10 an exclusively natural event.
A simple test for readers: three screens, not one colour
When you notice a milky sky, filtered sunshine or dust marks after rain, check the following in sequence:
- CAMS aerosol forecast: look for a plume of mineral dust crossing the Mediterranean towards the Balkans and Romania. Such a map provides transport context, not a measurement at your street corner.
- RNMCA data: check PM10, but also the hourly trend and several stations. The official PM10 index is calculated using the arithmetic mean of hourly values from the previous 24 hours, not only the latest instantaneous reading.
- Local weather: rain can create visible deposits, while wind can raise local dust. For atmospheric conditions in your locality, the Romania weather page can complete the overall picture.
The most convincing signal is the combination of a regionally tracked dust plume, a rise in PM10 across a wider area and wind conditions compatible with transport from the south or south-west. A weak signal is a single high value near a busy road, without checking maps or other stations.
Saharan dust does not cancel out the problem of local pollution
A Saharan transport event may explain a relevant part of the particle load on a particular day. It does not automatically explain values on all other days, nor does it negate known urban sources: traffic, fuel combustion, industrial activities, construction sites and resuspended dust. This is precisely why the label “it is only the Sahara” is as oversimplified as the opposite assumption, “it is only local pollution”.
The right question is not whether a map or a station is “right”. They measure different things. The map indicates whether the atmosphere has opened a corridor between the Sahara and Romania; the station shows what actually reached the air nearby. Only together can they outline an explanation for an episode.
Frequently asked questions
Why do cars get dirty after rain when Saharan dust arrives?
Rain can capture suspended mineral particles and deposit them on surfaces. Once the water evaporates, a layer of dust remains, often beige or reddish-brown.
Does a high PM10 value definitely mean Saharan dust?
No. PM10 shows the mass of particles no larger than 10 micrometres, not their source. For a plausible attribution, atmospheric transport maps, several stations, wind, rainfall and possibly other pollutants must be compared.
Why can two stations in the same city have different values?
Stations may have different purposes. A traffic station captures the influence of the road in its immediate vicinity, while an urban-background station reflects conditions over a wider area. Wind and local sources can accentuate the differences.
Is Saharan dust the same as local pollution?
No. It is a long-range natural transport of mineral aerosols, but it can increase the total concentration of particles in the air. At the same time, local sources may contribute to the value measured on the same day.
Sources consulted
- National Meteorological Administration — Statement on the transport of Saharan dust over Romania, 22 March 2025
- Copernicus Atmosphere Monitoring Service — Frequent Saharan dust plumes tracked across the Atlantic and over Europe
- National Air Quality Monitoring Network — Monitoring stations
- National Air Quality Monitoring Network — PM10 suspended-particle index
- European Environment Agency — Particulate matter PM10, Air quality status report 2025


Discuția cititorilor
Ai o opinie sau o întrebare despre acest articol? Spune-ne ce crezi.
Fii primul care deschide discuția.
Te rugăm să păstrezi un limbaj civilizat și să discuți la subiect. Comentariile spam sunt filtrate automat.