
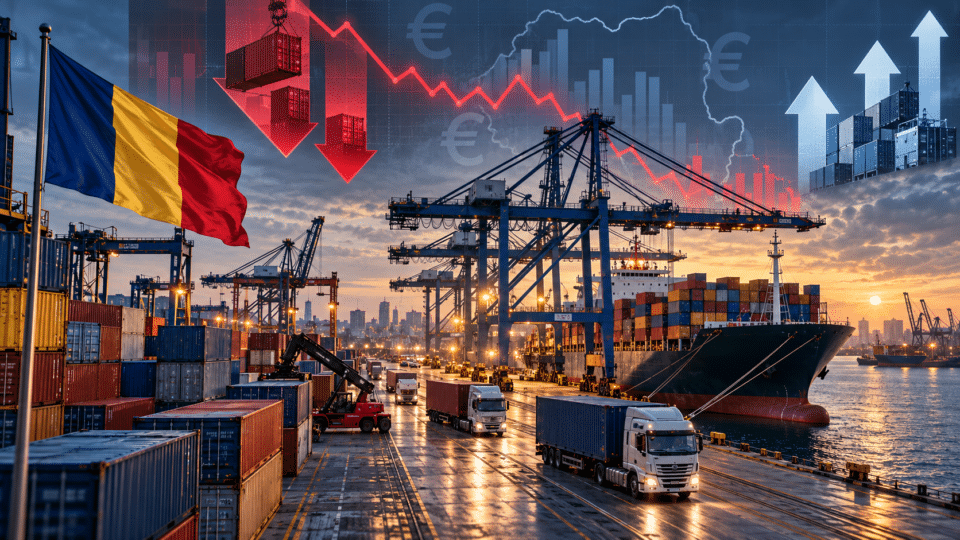
Romania bought €22.4448 billion more in goods from abroad than it sold in the first eight months of 2026. This was the difference between CIF imports of €88.2697 billion and FOB exports of €65.8249 billion. The figure is confirmed by release No. 260 from the National Institute of Statistics (INS), published on 12 October. What matters is not only the size of the deficit, but also its composition: chemical products, fuels, manufactured goods and transport equipment.
Compared with January–August 2025, the deficit widened by €307.2 million, or 1.4%. Exports grew faster in percentage terms than imports over the full period, but started from a considerably lower base. The result is a persistent imbalance in value terms, even when export growth is relatively strong.
For further context, see Russian gas in the EU: Yamal LNG imports reached 12.18 million tonnes. Estimated bill: €7.88 billion, which examines an aspect directly related to this subject.
The official picture: exports, imports and the deficit in the first eight months
| INS indicator | January–August 2026 | Compared with the same period of 2025 |
|---|---|---|
| FOB exports | €65.8249bn | +4.0% |
| CIF imports | €88.2697bn | +3.4% |
| FOB/CIF trade deficit | €22.4448bn | +€307.2m (+1.4%) |
| Exports in August | €7.5538bn | +11.6% compared with August 2025 |
| Imports in August | €10.6916bn | +13.7% compared with August 2025 |
The source for the table is the INS release of 12 October 2026. These are the values reported by the institution, not independent estimates. In August, the monthly deficit reached €3.1378 billion, meaning that month alone accounted for about 14% of the cumulative eight-month deficit.
Where the gap is: chemicals and fuels carry heavy weight
In the commodity-group breakdown, chemical products and related goods recorded imports of €13.2796 billion and exports of only €3.8515 billion. The difference, calculated from INS data, was about €9.43 billion. The category covers a broad range of industrial and chemical goods; the indicator does not support the conclusion that all of them could immediately and profitably be produced in Romania.
For mineral fuels, lubricants and related products, imports totalled around €8.00 billion, compared with €4.25 billion in exports: a gap of about €3.75 billion. For manufactured goods classified chiefly by material, the difference was close to €4.74 billion. These three areas show why discussion of the deficit cannot be reduced to supermarket purchases.
| Commodity group | Exports (€bn) | Imports (€bn) | Approximate difference |
|---|---|---|---|
| Chemical products and related goods | 3.85 | 13.28 | −€9.43bn |
| Fuels and related products | 4.25 | 8.00 | −€3.75bn |
| Manufactured goods classified chiefly by material | 9.90 | 14.65 | −€4.74bn |
| Machinery and transport equipment | 29.94 | 32.35 | −€2.41bn |
| Food and live animals | 5.31 | 7.60 | −€2.29bn |
The differences in the last table are editorial calculations based on rounded INS values and do not replace the official overall balance. There are also commodity groups with a trade surplus, so the negative differences should not be added together to derive the national deficit.
Why the car industry is both an export strength and a source of imports
Machinery and transport equipment account for 45.5% of goods exports and 36.6% of imports. Romania exports locally made cars, components and equipment, but an industry integrated into European supply chains also uses imported raw materials, parts, electronics, machinery and subassemblies.
The mere presence of imports in a strong export sector therefore does not automatically indicate economic failure. In a modern factory, components may cross borders at different stages of the production process. The relevant question is how much value added remains in the economy—in wages, investment, profits and taxes—and whether a larger share of supplies can be provided competitively by local companies.
More than 70% of trade is with the EU
According to INS, 71.6% of exports went to European Union member states, while 72.5% of imports originated there. In value terms, Romania sent €47.1511 billion worth of goods to the EU and brought in goods worth €64.0177 billion.
Reliance on European partners is not necessarily a vulnerability in itself: the single market provides access to customers and suppliers. But when external demand slows or domestic production costs rise, Romanian companies can be caught between difficulty exporting and the need to import for their own operations.
What the trade deficit means for the exchange rate, prices and jobs
A large trade deficit can increase an economy’s external financing needs, but does not automatically cause the leu to depreciate. Exchange-rate movements also depend on capital flows, investment, EU funds, interest rates, monetary policy and investor confidence. Similarly, higher imports do not mechanically translate into higher prices on shop shelves: prices depend on energy costs, competition, the exchange rate and retail margins.
The implications for jobs vary by sector. Rising machinery imports can support investment and productivity, while extensive substitution with finished products can affect local manufacturers if they cannot compete on price or quality. Effective industrial policy therefore does not mean banning imports, but creating conditions in which local companies can produce and export goods with higher value added.
A trade deficit is not a budget deficit
The two concepts are often confused. A trade deficit measures the difference between imports and exports of goods. A budget deficit occurs when government spending exceeds revenue. The current account, meanwhile, includes services, income and transfers as well as goods. There may be economic links between the indicators, but they are not interchangeable.
There is also a methodological point: INS compares exports calculated on an FOB basis—value at the exporter’s border—with imports measured on a CIF basis, including insurance and transport to the importer’s border. The FOB/CIF deficit is therefore not statistically identical to every other measure of external trade.
What to watch through the end of 2026
- The structure of imports: whether the increase is driven by productive investment, energy or final consumption.
- The pace of industrial exports: especially cars, equipment, chemicals and more highly processed goods.
- August compared with the following months: a single month can be affected by seasonality, large deliveries or prices; identifying a trend requires more observations.
- The competitiveness of factories: energy costs, productivity, logistics, tax stability and labour availability.
- Investment that fills missing links: competitive local capacity, rather than the artificial substitution of every import.
The gap will not close simply by increasing exports
INS data describe an economy that is succeeding in selling more abroad while continuing to buy substantially more from outside the country. The task for the coming years is to change the structure of production: investment capable of turning resources, knowledge and components into products that can compete on international markets. The August indicator alone cannot show whether economic policy has succeeded or failed, but it identifies where the questions should be asked.
Sources and methodology
- INS, Press Release No. 260, 12 October 2026 — data for August and January–August, and the FOB/CIF methodology; the official document is available in a PDF copy published by the press.
- INS — archive of international trade in goods releases.
- InfoBuz context: Cernavodă and risks to the energy system, for the energy component of the economy.


Discuția cititorilor
Ai o opinie sau o întrebare despre acest articol? Spune-ne ce crezi.
Fii primul care deschide discuția.
Te rugăm să păstrezi un limbaj civilizat și să discuți la subiect. Comentariile spam sunt filtrate automat.