
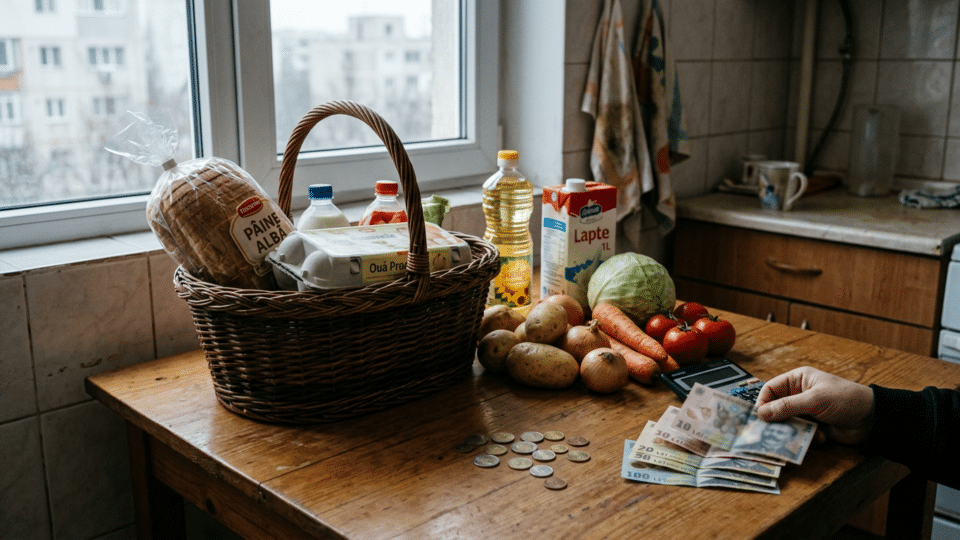
Romania’s annual inflation rate reached 6.94% in October 2026, up from 6.61% in September, according to data attributed to the National Institute of Statistics. But the headline figure tells only part of the story for household budgets: services rose by an average of 11.23% over the year, compared with 7.66% for non-food goods and 3.07% for food.
For more on the cost of living, see Household inflation: why tenants, pensioners and families with children experience 2026 differently, which provides complementary details on the subject.
For a household that pays monthly rent, building charges, water bills, subscriptions, transport or other contracted services, that difference may matter more than the 6.9% average. For another household that spends more on food and less on services, the pressure may look different. The consumer price index is not a personalised bill: it measures changes in an average basket of consumer spending.
What we know now: public data for October point to faster inflation than in September and a much higher rate of price growth for services than for food. On their own, they do not make it possible to calculate the inflation “felt” by each family, nor to establish the exact contribution of each group to the overall rate without the full weights of the CPI basket.
Inflation at 6.9%: four figures that do not mean the same thing
Discussions of inflation often mix indicators calculated over different periods. Making the right comparison helps explain the pace of price increases without turning a single number into a verdict on all current expenditure.
| Indicator | Value reported for October 2026 | What it compares | What it does not show |
|---|---|---|---|
| Annual CPI rate | 6.94% | October 2026 compared with October 2025 | The exact price increase in an individual family’s basket |
| Monthly change | 0.82% | October 2026 compared with September 2026 | The full increase accumulated over a year |
| Increase since the start of the year | 6.3% | October compared with December 2025 | The annual inflation rate |
| Average rate over 12 months | 9.0% | The average for November 2025–October 2026 compared with the preceding 12 months | The price increase in a single month |
The reference document for these figures is the National Institute of Statistics release on the consumer price index for October 2026. The 6.94% rate is a year-on-year comparison. In other words, it shows how much higher the average price level was in October 2026 than in October 2025; it does not mean that all prices rose by the same percentage, or that all of them increased in October.
Services recorded the fastest price growth
Of the CPI’s three broad groups, services posted the largest annual increase, at 11.23%. Non-food goods rose by 7.66%, while food prices increased by 3.07%.
The distinction matters because many services are recurrent expenses or difficult to postpone. Housing payments, managed utilities, some transport services, communications and repairs can account for a significant share of a household budget, even if they are not bought as visibly as everyday food.
Media reports based on National Institute of Statistics tables pointed to sharp annual increases in several categories, including rents, water, sewerage and sanitation services, television subscriptions and air transport. Fuel prices also rose steeply compared with October 2025: diesel by 43.45% and petrol by 32.91%, according to INS data reported by Știrile ProTV.
These examples should not be generalised. The statistical category of “rents”, for example, is not the same as all listings on the private market, while fuel is a more significant direct expense for households that depend on a car. A high growth rate also does not automatically mean the largest contribution to overall inflation: that contribution also depends on a category’s weight in the consumer basket.
Food prices rose less on average, but the average conceals different products
The average 3.07% increase in food prices was markedly lower than the increase in services. Yet an average for a group does not mean that every food product became cheaper or more expensive by roughly 3%.
Media-reported data show higher annual rates for coffee, eggs, milk and edible oil. For a consumer who buys such products frequently, what they see on the shelf may differ from the aggregate food-price index. Families with children, pensioners and people who mostly cook at home may likewise have substantially different shopping baskets.
That is the inherent limitation of a national inflation rate: it is necessary for identifying the broader trend, but it cannot replace the actual spending pattern of an individual household.
Why recurring expenses can weigh more than the headline figure
A recurring expense cannot be adjusted as easily as an occasional purchase. A family may change product brands, put off a non-essential item or temporarily cut back on some outings. It is harder to quickly reduce rent, a contractual subscription, the cost of travelling to work or certain essential services.
This is why the phrase “services weigh most heavily on household budgets” should be read cautiously: it describes the risk of greater exposure for households with many recurring expenses, rather than a direct measurement of every budget in Romania.
- Tenants may be more sensitive to changes in housing costs if those costs account for a large share of their income.
- Commuters and drivers may feel higher fuel prices more quickly, especially where car use is difficult to replace.
- Households with numerous recurring service costs may have greater exposure to the 11.23% rise in services.
- People whose spending is predominantly on food may have a different experience, because the food group recorded a lower average annual rate, albeit with major variation between products.
In a macroeconomic analysis published in October 2026, the European Commission says household consumption adjusted in the context of high inflation and changes in real incomes. This is an economy-wide signal, not evidence that inflation was the sole cause of changes in consumer behaviour: interest rates, taxes, incomes and uncertainty may simultaneously influence household decisions.
What to monitor in your own budget
The CPI rate is useful as a benchmark, but for day-to-day decisions it is more useful to track the categories that take up the largest share of a household’s own budget. A simple check over two or three months can give a clearer picture of where pressure is concentrated.
- separate fixed expenses: housing, utilities, loan instalments, transport and subscriptions;
- compare the quantity consumed with the unit price, especially for fuel and frequently purchased food;
- do not automatically project an exceptional rate of increase in one category into the future;
- check bills and contracts before attributing an increase solely to general inflation.
Monetary policy is also worth following separately. The policy rate affects borrowing costs and financial conditions, but it does not feed through automatically or immediately to every instalment payment or price. The context of the November decision is explained in InfoBuz’s analysis of the National Bank of Romania’s policy rate and its effects on loans, deposits and the leu exchange rate.
In essence, inflation of 6.94% confirms that the general price level continued to rise at a high rate. The breakdown by group, however, shows why the experience is not uniform: services and certain recurring expenses are increasing much faster than food prices on average, while the practical impact depends on the composition of each budget.
Frequently asked questions
What does annual inflation of 6.94% mean?
It means that the average level of consumer prices in October 2026 was 6.94% higher than in October 2025. It does not mean that every product or service became more expensive by that percentage.
Why can services be harder to afford than food?
Many services are recurrent or difficult-to-postpone payments, such as housing, utilities, transport and certain subscriptions. The impact nevertheless varies from one household to another, depending on the share these costs take up in its budget.
Did services automatically make the largest contribution to overall inflation?
That does not automatically follow from the 11.23% rate. A group’s contribution to overall inflation depends both on its rate of price growth and its weight in the CPI basket. An exact conclusion requires the weights and contributions published in the statistical documentation.



Discuția cititorilor
Ai o opinie sau o întrebare despre acest articol? Spune-ne ce crezi.
Fii primul care deschide discuția.
Te rugăm să păstrezi un limbaj civilizat și să discuți la subiect. Comentariile spam sunt filtrate automat.