
Updated: 22 November 2026 la 11:13. Articolul a fost revizuit pentru a reflecta informațiile disponibile la această dată.
Tourism by land: Eurostat data put Romania’s share of residents’ tourist trips made primarily by land transport at 94% in 2025. This article examines what the indicator measures, why it does not mean that 94% of Romanians travel by car, and how the costs of rail, coach and car travel can be compared.
Eurostat data on land-based tourist travel in Romania
According to Eurostat data for 2025, 94% of tourist trips taken by Romanian residents had a land-based mode as their main means of transport—the highest share in the EU. The indicator concerns residents’ tourist trips, rather than all daily travel or only foreign visitors arriving in Romania.
What the 94% figure means
Under the statistical classification, land transport includes cars, trains and coaches. It would therefore be inaccurate to say that 94% of Romanians travel exclusively by car.
The percentage describes trips, not the number of unique people, total distance travelled or the share of spending. One person may make several trips in a year, with each counted separately. A trip can also involve several stages, but is assigned a principal mode of transport. The 94% figure consequently measures neither total kilometres nor every means of transport used along the route.
Calculating the share attributable to cars alone would require a breakdown by transport mode, rather than simply reading the aggregate land-transport category. That distinction materially changes interpretations of claims about Romanians travelling on holiday by private car.
Why land transport is so popular
Distances to domestic destinations and neighbouring countries, flexibility, the cost of luggage and transfers, and family preferences can all influence the choice. Flying may be faster over long distances, but total journey time also includes the transfer to the airport, security procedures and travel onwards to the accommodation.
A high share of land transport may also be influenced by the number of domestic holidays, distances to neighbouring countries, the airport network and the accessibility of public transport. International comparisons need to use the same methodology, reference period and definition of a tourist trip.
A country with many short domestic trips may have a high land-transport share even if its population flies for a large proportion of more distant holidays. The indicator is not, by itself, a rating of infrastructure quality or a ranking of individual preferences.
Romania’s coast, mountains, Danube Delta and rural tourism
Romania’s seaside, the Danube Delta, spa resorts, mountain areas and rural localities can be reached by land. Road travel is also an option for many tourists heading to Bulgaria, Greece and Hungary. However, this observation does not establish the exact distribution of destinations in Eurostat’s statistics.
For the Danube Delta, part of the journey may require water transport, illustrating why the “main mode” and all modes used are not identical.
In Constanța County, seasonality creates peaks in road traffic and concentrated demand for rail travel. Transport planning needs to distinguish tourist flows from local commuting. In this context, see InfoBuz’s analysis of the Constanța Metropolitan Train and the limits of projects still at the feasibility-study stage.
Car, train or coach?
A car offers flexibility and room for luggage, but entails fuel, tolls, parking, wear and tear, and driver fatigue. Rail can reduce the stress of driving, but depends on timetables, frequency and local connections. Coaches may offer competitive fares, although journey time and comfort vary.
A valid comparison should cover the same route and the same number of passengers. For air travel, the tickets for every passenger, luggage, transfers and time spent at the airport must be included. For rail and coach, travellers should compare fares for all passengers, applicable discounts, transfers and the cost of reaching the accommodation.
A car may be competitive for four people but less advantageous for a solo traveller. The result depends on the route and the booking date.
Illustrative cost: a family of four
For a 1,000-kilometre round trip, fuel consumption of 6.5 litres per 100 km means using 65 litres. At a hypothetical price of 8 lei per litre, fuel would cost 520 lei. Divided among four people, that is 130 lei per person for fuel alone.
This is an illustrative calculation, not a real offer or the actual price of fuel on 21 November 2026. It excludes Romania’s road vignette, foreign tolls, parking, depreciation, maintenance and any additional overnight stays.
Door-to-door time can change the result
A two-hour flight is not a two-hour total journey. The journey to the airport, arrival before departure, baggage collection and the final transfer all need to be added. Similarly, a train with a competitive running time can become inconvenient if departures are infrequent or the station is far from the destination.
One hypothetical example—45 minutes to the airport, 120 minutes of preparation, a 120-minute flight and 60 minutes to the accommodation—totals 345 minutes, or five hours and 45 minutes. This is not a real itinerary; it shows why complete routes, rather than headline prices alone, should be compared.
Time matters when choosing transport. A family driving for many hours may need an extra night of accommodation, while a flight may entail transfers and waiting time. A proper comparison includes the costs for all passengers and the full duration of the journey.
What the statistic does—and does not—say about infrastructure
The share of land transport may reflect geography and the transport offer, but it does not by itself prove that roads are adequate or that rail services run frequently enough. Public decisions require separate assessment of safety, accessibility, congestion and connections between transport modes.
Links between rail stations, coach stations, airports and tourist destinations, real-time information, integrated tickets, accessible stations and seasonal local transport could improve the experience without requiring every tourist to use a private car.
Investment should be prioritised according to the number of travellers served, safety, cost and effects on congestion. A widened road may temporarily reduce journey times, but it does not automatically address the lack of alternatives for people without a car. A well-functioning tourism system does not mean new roads alone; it also means being able to reach a destination without a private car.
Safety and environmental impact
Long car journeys involve exposure to fatigue, poor weather and congestion. Breaks, tyre-pressure checks, securing luggage and the correct use of child-restraint systems are essential. No financial saving justifies continuing to drive while fatigued.
Statistical safety comparisons between transport modes should use risk rates per passenger-kilometre or other appropriate units, rather than raw incident totals. Road-accident data cannot be converted directly into a measure of tourism risk without further information.
Emissions per passenger vary according to distance, energy source, vehicle occupancy and operating conditions. A car carrying four passengers has a different profile from one carrying a single occupant. Rail’s impact depends on traction and the energy mix, while aviation’s depends on aircraft type and occupancy.
A meaningful comparison needs the same unit, such as emissions per passenger-kilometre, and should specify which emissions categories are included. The 94% figure cannot be converted into a national emissions estimate without data on distances and the specific transport modes used.
Frequently asked questions
Does 94% mean that 94% of Romanians go on holiday by car?
No. The percentage refers to trips and to the aggregated category of land transport. It includes trains and coaches, not only private cars.
Are all daily journeys included?
No. The indicator covers tourist trips.
Is this a statistic about foreign tourists visiting Romania?
No. It concerns trips made by residents of Romania.
Are these 2026 data?
No. They are data for 2025, published later.
Does the figure show that flying is more expensive?
No. Prices must be compared for specific routes and periods.
Can it be compared directly with airport passenger numbers?
No. The methodology and units of measurement differ.
Sources and methodology
The reporting is based on Eurostat tourism statistics, supplemented by information from Romania’s National Institute of Statistics. Interpretation requires checking the year 2025, the reference population, the definition of a trip and the classification of the principal mode of transport.
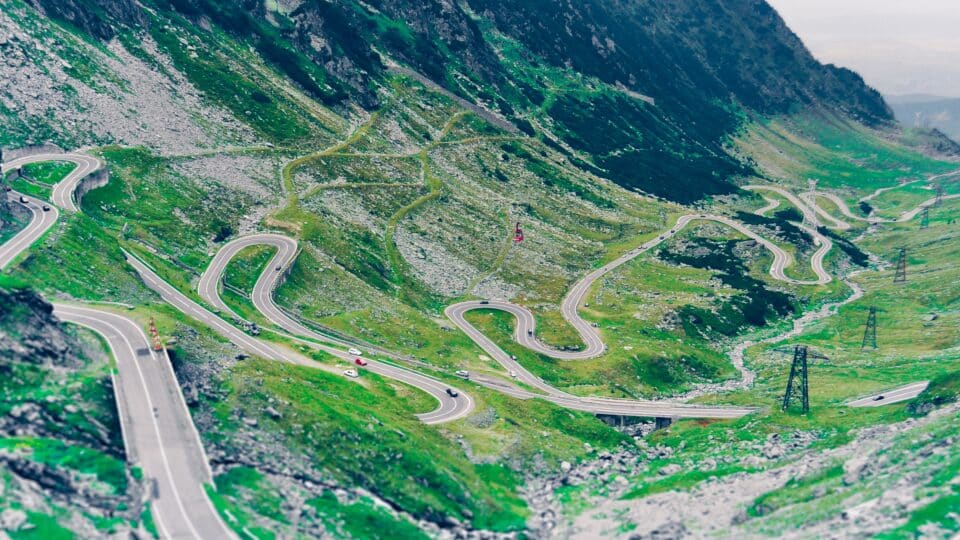
The article’s cost examples are illustrative. Eurostat’s 94% indicator is not presented here as measuring fares, accidents or emissions. For related context, see InfoBuz’s article on transport accessibility. The Transfăgărășan photograph is illustrative. Checked on 21 November 2026; editorial review: 22 November 2026.



Discuția cititorilor
Ai o opinie sau o întrebare despre acest articol? Spune-ne ce crezi.
Fii primul care deschide discuția.
Te rugăm să păstrezi un limbaj civilizat și să discuți la subiect. Comentariile spam sunt filtrate automat.