
The risk of poverty and social exclusion in Romania remains among the highest in the European Union. According to Eurostat data for 2025, published on 30 April 2026, 27.4% of Romania’s population were in at least one of the situations covered by the European indicator. Romania ranked third in the EU on this measure, after Bulgaria, at 29.0%, and Greece, at 27.5%. The EU average was 20.9%.
These figures say something important about economic inequality and people’s ability to participate in social life. But they are often misread: 27.4% does not mean that precisely this share of Romanians cannot afford food, are homeless, or experience every form of deprivation at once. The AROPE indicator has three distinct components, and a person is included in the statistics if they meet at least one of them.
Why Romania ranks third in the European Union
For 2025, Eurostat reported the highest rates of risk of poverty or social exclusion in Bulgaria (29.0%), Greece (27.5%) and Romania (27.4%). At the other end of the scale were Czechia (11.5%), Poland (15.0%) and Slovenia (15.5%). The differences point to contrasts between societies, but cannot be explained solely by the minimum wage or a single economic indicator.
For more on Romania’s economy, see Inflation has reached 10.7%: why Romanians are paying more even as wages fail to keep up, which provides complementary detail on the subject.
Across the EU, around 92.7 million people, or 20.9% of the population, faced at least one of the three risks included in AROPE. Compared with 2024, the European total fell slightly, by about 600,000 people, while the rate declined by 0.1 percentage points. This is a modest improvement, not the disappearance of inequality.
In Romania, the indicator stood at about 27.9% for 2024, according to Eurostat’s publication of April 2025. The difference from the 27.4% recorded in 2025 suggests a fall of 0.5 percentage points in the published series. It should not, however, be confused with a 0.5% fall in all prices or an equivalent rise in every family’s income; the figures come from statistical surveys and use their own methodology.
What the AROPE indicator measures and why it matters
AROPE stands for At Risk of Poverty or Social Exclusion. Under Eurostat’s methodology, a person is included if they are in at least one of three situations: at risk of monetary poverty after social transfers, severe material and social deprivation, or living in a household with very low work intensity.
These components can overlap. An adult on a low income may live in a family facing material hardship and with few months in employment. In the statistics, that person should not be counted three times, but once in the overall indicator. Simply adding together the percentages for the components would therefore overstate the population at risk.
The indicator is useful for public policy because income alone does not show whether a household can afford to heat its home, replace an essential appliance, take part in social activities or withstand an unexpected expense. But AROPE is not an exhaustive measure of every hardship, either, and cross-country comparisons require attention to housing costs and household structure.
Monetary poverty is relative to income in each country
The monetary component uses an income threshold set at 60% of median equivalised disposable income after social transfers. This means that the threshold depends on income distribution within the country concerned. A person may be classified as at risk of poverty in a high-income economy even if their nominal income is higher than that of someone in a country with generally lower wage levels.
For this reason, Romania’s place in the ranking cannot be read as a direct comparison of the number of euros in each person’s pocket. The indicator captures a person’s position within society and interacts with two other dimensions. A full analysis would require median incomes, housing costs, household size and purchasing power.
Severe deprivation: when shortages affect daily life
Severe material and social deprivation tracks whether people cannot afford a specified number of goods, services or activities considered necessary in a European society. It differs from a voluntary decision not to buy a product. Statisticians seek to identify cases in which financial resources prevent access to elements of everyday life.
Relevant examples include difficulty meeting unexpected expenses, keeping a home adequately warm, or taking part in certain social activities. The indicator uses a precise list of conditions, rather than an inspector’s impression of how modern a home looks.
A household can own its home and still face deprivation. Likewise, owning a phone does not prove that a person is not experiencing hardship. Material life is more complex than a television image of a consumer good.
Young people in Romania: a more serious problem than the EU average
A separate indicator published by Eurostat on 17 June 2026 shows that, in 2025, 15.1% of Romanians aged 15 to 29 experienced severe material and social deprivation. This was the highest rate in the EU for this age group, compared with a European average of 5.8%.
It is important to stress that 15.1% is a different indicator from AROPE at 27.4%. The first concerns a severe component among young people; the second is the combination of three risks for the total population. There is no statistical basis for adding them together or claiming that 42.5% of young people are poor.
These data raise questions about the transition from education to work, access to housing, regional differences and families’ ability to support young people at the start of adult life. Assigning a causal role to any one factor would require further analysis using data on income, unemployment, living costs and household structure.
Why wages and shelf prices do not tell the whole story
A family may have two adults in work but still face high housing, heating, healthcare and transport costs. In another household, a modest pension may be supplemented by other resources. Poverty statistics therefore cannot be explained by a single news report about the minimum wage.
Inflation changes purchasing power and can worsen hardship, but AROPE is not a direct measure of inflation. A price may rise by 10% without the share of people at risk rising by exactly 10%; incomes, transfers and patterns of consumption can move differently.
A serious economic analysis must distinguish between nominal income, real income, the relative poverty threshold and actual deprivation. Confusing these concepts produces dramatic headlines that do not help readers understand the situation.
Urban-rural differences cannot be inferred from a single ranking
Within a country, there can be major disparities between regions, urban and rural areas, age groups, households with children, people living alone and pensioners. The national AROPE figure of 27.4% does not automatically show the precise risk in a county or neighbourhood. Local analysis requires disaggregated data, comparable methodology and sufficiently large samples.
In one area, the main cause of hardship may be a lack of jobs; in another, housing costs or difficult access to services. Reducing every situation to the phrase “Romanians are poor” conceals both the mechanisms involved and possible solutions.
The role of social policy and public services
Household disposable income is shaped by wages, pensions and social transfers. Public services — education, healthcare, transport and social protection — can reduce certain costs borne directly by families. The effect of programmes should be assessed through outcomes and actual access, not only by the total sum announced in a budget.
For example, a support programme may have sound criteria on paper but fail to reach eligible people if the procedures are inaccessible. Conversely, an increase in income may not fully resolve the problems of a community without water, public transport or access to medical services. Tackling poverty requires a broader perspective than the payment of a single benefit.
In a separate analysis, InfoBuz explained why a low energy bill can conceal inadequate heating. This is an example of the difference between a financial indicator and actual living conditions.
Questions authorities should ask in 2027
It is worth examining whether the AROPE rate is genuinely falling among the most vulnerable groups, rather than only in the national average. Other questions include whether support reaches people with children, whether access to school and medical services is improving, and whether young people can move from education into stable jobs.
A sound assessment must compare time series, methodology and any changes in the definitions of indicators. A small year-on-year variation should be read alongside survey uncertainty and economic changes, rather than automatically presented as a final victory or failure.
Frequently asked questions about poverty in Romania
Is Romania the poorest country in the EU?
That is not the correct way to describe the data cited. For the 2025 AROPE indicator, Romania ranked third, after Bulgaria and Greece.
Can 27.4% of Romanians not afford food?
No. The percentage represents exposure to at least one of three statistically defined risks.
What does the 15.1% figure for young people represent?
It is the rate of severe material and social deprivation among people aged 15 to 29 in Romania in 2025.
Did the situation improve compared with 2024?
AROPE fell in the published series from 27.9% to 27.4%. A broader assessment requires other indicators as well, not just the difference of 0.5 percentage points.
Why poverty risk can remain high even as the economy grows
Growth in gross domestic product is not distributed identically among all households. Some sectors may see substantial gains while other groups are affected by higher housing costs, limited mobility or unstable incomes. The AROPE indicator captures part of this difference: even where economic activity is growing, some people may continue to have incomes below the relative threshold or face serious material hardship.
The reverse is also possible: a relative indicator of monetary poverty can change when the overall income distribution changes, without every household’s life improving at the same pace. This is why the statistics must be compared with real wages, the state of social transfers and the prices of essential goods. A macroeconomic average cannot replace data on people’s concrete difficulties.
How to properly assess a public programme to reduce poverty
The first step would be to clearly identify the target population, eligibility criteria and the problem the programme seeks to solve. A benefit intended for households with children has a different logic from a school transport project or an intervention to improve access to a doctor. Success should be measured by outcomes: how many eligible beneficiaries were actually supported, how long the improvement lasted and what side effects emerged.
Publishing a large allocated sum is not enough. Information is needed on how many people were reached, the cost of the intervention per beneficiary, and whether the measures reduced the observed hardships. A well-funded programme may deliver modest results if access is complicated, while one with lower expenditure may have significant effects for a highly vulnerable group. Evaluations should be independent and allow for adjustments.
What readers can do with Eurostat data beyond rankings
European indicators can help frame questions for authorities: where are the largest gaps, which groups benefit from services, and where is local data missing? A valid answer requires the same methodology to be used from one year to the next. Figures for young people, households with children and the total population have different bases and cannot be combined arbitrarily.
Journalistic reporting also carries a responsibility: people facing hardship should not be turned into background images or symbols of a country. Statistics can describe the scale of a problem, while individual stories require consent, respect for privacy and fact-checking. This article uses a generic image precisely to avoid suggesting that a particular person took part in the Eurostat survey.
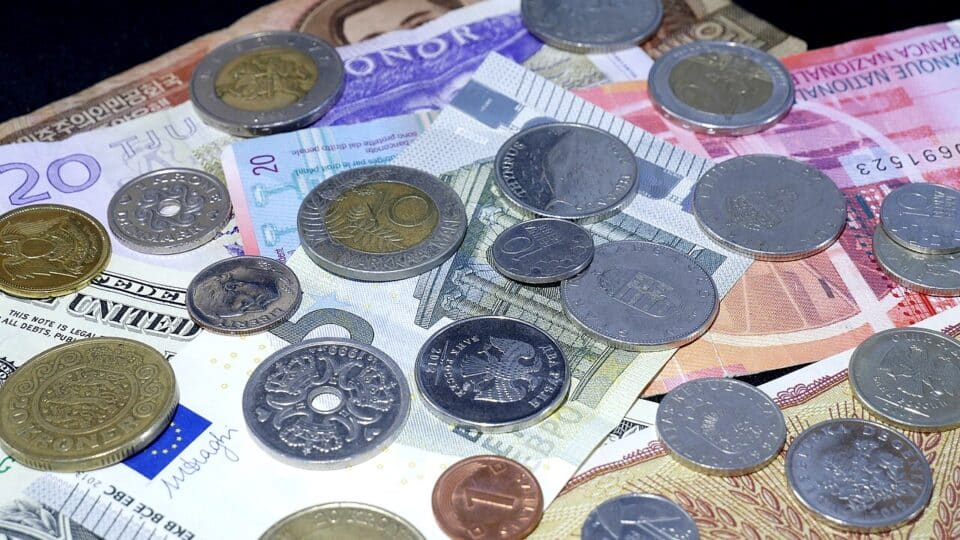
Feature photo: banknotes and coins from several countries, generic image; it does not represent the income of any household included in the Eurostat study. Photo: Santeri Viinamäki / Wikimedia Commons, CC BY-SA 4.0.
Official sources and methodology
- Eurostat – 20.9% of people at risk of poverty or social exclusion, 30 April 2026.
- Eurostat – EU youth deprivation unchanged at 5.8% in 2025, 17 June 2026.
- Eurostat – People at risk of poverty or social exclusion in 2024.
- Eurostat – Key figures on Europe, 2026 edition.
InfoBuz, 9 October 2026. The data refer to the 2025 observation year, not the 2026 publication year. The photograph is generic and does not depict a person identified in the statistical survey.


Discuția cititorilor
Ai o opinie sau o întrebare despre acest articol? Spune-ne ce crezi.
Fii primul care deschide discuția.
Te rugăm să păstrezi un limbaj civilizat și să discuți la subiect. Comentariile spam sunt filtrate automat.